In statistics, data points Do not mean a sampling Mean total number of cases in a Mean total number of parameter O b. estimates Mean total number of O a. Size O C-study O d. variables
In statistics, data points Do not mean a sampling Mean total number of cases in a Mean total number of parameter O b. estimates Mean total number of O a. Size O C-study O d. variables

Glencoe Algebra 1, Student Edition, 9780079039897, 0079039898, 2018
18th Edition
ISBN:9780079039897
Author:Carter
Publisher:Carter
Chapter4: Equations Of Linear Functions
Section: Chapter Questions
Problem 8SGR

Related questions
Question
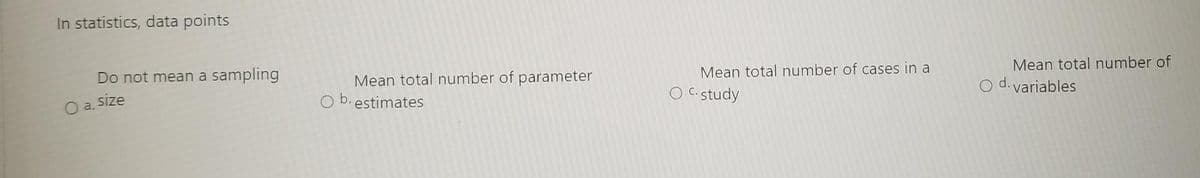
Transcribed Image Text:In statistics, data points
Do not mean a sampling
Mean total number of parameter
O b. estimates
Mean total number of cases in a
Mean total number of
O a. size
O C. study
O d. variables
Expert Solution
This question has been solved!
Explore an expertly crafted, step-by-step solution for a thorough understanding of key concepts.

Step by step
Solved in 2 steps

Recommended textbooks for you
Glencoe Algebra 1, Student Edition, 9780079039897…
Algebra
ISBN:
9780079039897
Author:
Carter
Publisher:
McGraw Hill
Glencoe Algebra 1, Student Edition, 9780079039897…
Algebra
ISBN:
9780079039897
Author:
Carter
Publisher:
McGraw Hill