(a) Do the data in the table present sufficient evidence to indicate a difference in the average prices of light tuna in water versus oil? Test using a = 0.05. State the null and alternative hypotheses. O Ho: (H₁-H₂) = 0 versus H₂: (H₁-H₂) <0 O Ho: (H₁-H₂) < 0 versus H₂: (μ₁ −µ₂) > 0 Ho: (H₁-H₂) = 0 versus H₂: (H₁-H₂) = 0 O Ho: (H₁-H₂) = 0 versus H₂: (μ₁ −μ₂) = 0 O Ho: (H₁-H₂) = 0 versus H₂: (H₁-H₂) >0 State the test statistic. t= State the rejection region. (If the test is one-tailed, enter NONE for the unused region. Round your answers to three places.)
(a) Do the data in the table present sufficient evidence to indicate a difference in the average prices of light tuna in water versus oil? Test using a = 0.05. State the null and alternative hypotheses. O Ho: (H₁-H₂) = 0 versus H₂: (H₁-H₂) <0 O Ho: (H₁-H₂) < 0 versus H₂: (μ₁ −µ₂) > 0 Ho: (H₁-H₂) = 0 versus H₂: (H₁-H₂) = 0 O Ho: (H₁-H₂) = 0 versus H₂: (μ₁ −μ₂) = 0 O Ho: (H₁-H₂) = 0 versus H₂: (H₁-H₂) >0 State the test statistic. t= State the rejection region. (If the test is one-tailed, enter NONE for the unused region. Round your answers to three places.)

Mathematics For Machine Technology
8th Edition
ISBN:9781337798310
Author:Peterson, John.
Publisher:Peterson, John.
Chapter29: Tolerance, Clearance, And Interference
Section: Chapter Questions
Problem 16A: Spacers are manufactured to the mean dimension and tolerance shown in Figure 29-12. An inspector...

Related questions
Question
I need help with all parts of this queestion 6, the select options for C is greater thna or less than, and is or is not
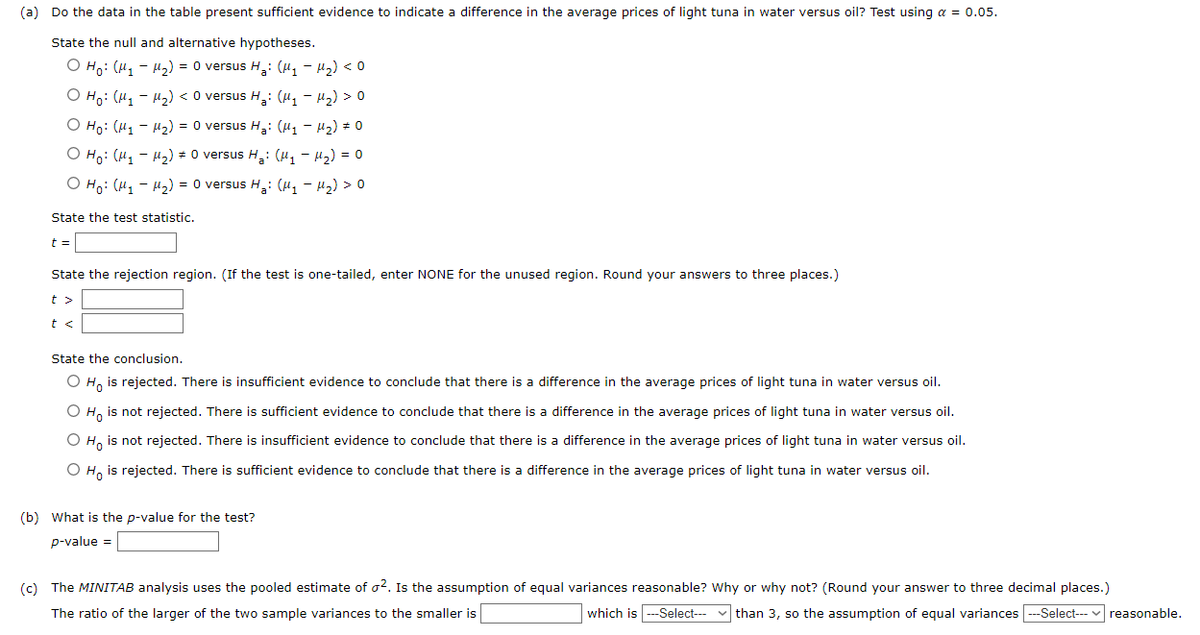
Transcribed Image Text:(a) Do the data in the table present sufficient evidence to indicate a difference in the average prices of light tuna in water versus oil? Test using a = 0.05.
State the null and alternative hypotheses.
O Ho: (M₁M₂) = 0 versus H₂: (M₁ - H₂) <0
O Ho: (M₁M₂) < 0 versus H₂: (M₁-M₂) >0
O Ho: (M₁M₂) = 0 versus H₂: (μ₁ −μ₂) # 0
O Ho: (M₁M₂) 0 versus H₂: (μ₁ −μ₂) = 0
O Ho: (M₁M₂) = 0 versus H₂: (M₁M₂) >0
State the test statistic.
t =
State the rejection region. (If the test is one-tailed, enter NONE for the unused region. Round your answers to three places.)
t>
State the conclusion.
O Ho is rejected. There is insufficient evidence to conclude that there is a difference in the average prices of light tuna in water versus oil.
O Ho is not rejected. There is sufficient evidence to conclude that there is a difference in the average prices of light tuna in water versus oil.
O Ho is not rejected. There is insufficient evidence to conclude that there is a difference in the average prices of light tuna in water versus oil.
O Ho is rejected. There is sufficient evidence to conclude that there is a difference in the average prices of light tuna in water versus oil.
(b) What is the p-value for the test?
p-value =
(c) The MINITAB analysis uses the pooled estimate of o². Is the assumption of equal variances reasonable? Why or why not? (Round your answer to three decimal places.)
The ratio of the larger of the two sample variances to the smaller is
which is ---Select--than 3, so the assumption of equal variances ---Select--- reasonable.
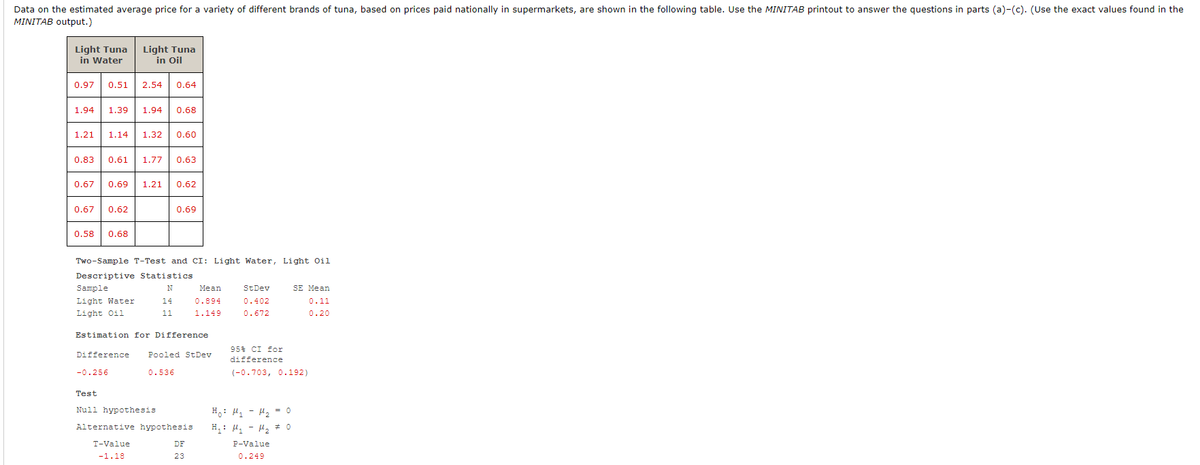
Transcribed Image Text:Data on the estimated average price for a variety of different brands of tuna, based on prices paid nationally in supermarkets, are shown in the following table. Use the MINITAB printout to answer the questions in parts (a)-(c). (Use the exact values found in the
MINITAB output.)
Light Tuna
in Water
0.97 0.51
1.94 1.39 1.94 0.68
1.21 1.14 1.32 0.60
0.83 0.61 1.77 0.63
0.67 0.62
0.67 0.69 1.21 0.62
0.58 0.68
Light Tuna
in Oil
2.54 0.64
Sample
Light Water
Light Oil
Two-Sample T-Test and CI: Light Water, Light Oil
Descriptive Statistics
N
14
Difference
-0.256
Estimation for Difference
T-Value
-1.18
0.69
11
Test
Null hypothesis
Pooled StDev
0.536
Alternative hypothesis
Mean
0.894
1.149
DF
23
StDev
0.402
0.672
H₂ M₁
H₂: M₂
95% CI for
difference
(-0.703, 0.192)
M₂ = 0
M₂ #0
SE Mean
0.11
0.20
P-Value
0.249
Expert Solution
This question has been solved!
Explore an expertly crafted, step-by-step solution for a thorough understanding of key concepts.

Step by step
Solved in 3 steps with 1 images

Recommended textbooks for you
Mathematics For Machine Technology
Advanced Math
ISBN:
9781337798310
Author:
Peterson, John.
Publisher:
Cengage Learning,

Glencoe Algebra 1, Student Edition, 9780079039897…
Algebra
ISBN:
9780079039897
Author:
Carter
Publisher:
McGraw Hill
Mathematics For Machine Technology
Advanced Math
ISBN:
9781337798310
Author:
Peterson, John.
Publisher:
Cengage Learning,
Glencoe Algebra 1, Student Edition, 9780079039897…
Algebra
ISBN:
9780079039897
Author:
Carter
Publisher:
McGraw Hill