A doctor released the results of clinical trials for a vaccine to prevent a particular disease. In these clinical trials, 200,000 children were randomly divided in two groups. The subjects in group 1 (the experimental group) were given the vaccine, while the subjects in group 2 (the control group) were given a placebo. Of the 100,000 children in the experimental group, 18 developed the disease. Of the 100,000 children in the control group, 34 developed the disease. Complete parts (a) through (f) below. E PI(1-P1J 2 10 anu nzp21- P2] 210 O C. The samples are dependent. D. The sample size is less than 5% of the population size for each sample. O E. The sample size is more than 5% of the population size for each sample. O F. The data come from a population that is normally distributed. Identify the null and alternative hypotheses for this test. Let p, represent the population proportion of children given the vaccine who developed the disease and p2 represent the population proportion of children given a placebo who developed the disease. Họ: P1 = P2 H: P1 < P2 Find the test statistic for this hypothesis test. (Round to two decimal places as needed.)
A doctor released the results of clinical trials for a vaccine to prevent a particular disease. In these clinical trials, 200,000 children were randomly divided in two groups. The subjects in group 1 (the experimental group) were given the vaccine, while the subjects in group 2 (the control group) were given a placebo. Of the 100,000 children in the experimental group, 18 developed the disease. Of the 100,000 children in the control group, 34 developed the disease. Complete parts (a) through (f) below. E PI(1-P1J 2 10 anu nzp21- P2] 210 O C. The samples are dependent. D. The sample size is less than 5% of the population size for each sample. O E. The sample size is more than 5% of the population size for each sample. O F. The data come from a population that is normally distributed. Identify the null and alternative hypotheses for this test. Let p, represent the population proportion of children given the vaccine who developed the disease and p2 represent the population proportion of children given a placebo who developed the disease. Họ: P1 = P2 H: P1 < P2 Find the test statistic for this hypothesis test. (Round to two decimal places as needed.)

Holt Mcdougal Larson Pre-algebra: Student Edition 2012
1st Edition
ISBN:9780547587776
Author:HOLT MCDOUGAL
Publisher:HOLT MCDOUGAL
Chapter11: Data Analysis And Probability
Section: Chapter Questions
Problem 8CR

Related questions

Topic Video
Question
Can you help me determine the test statistic, the P-value, and the conclusion for this hypothesis test?
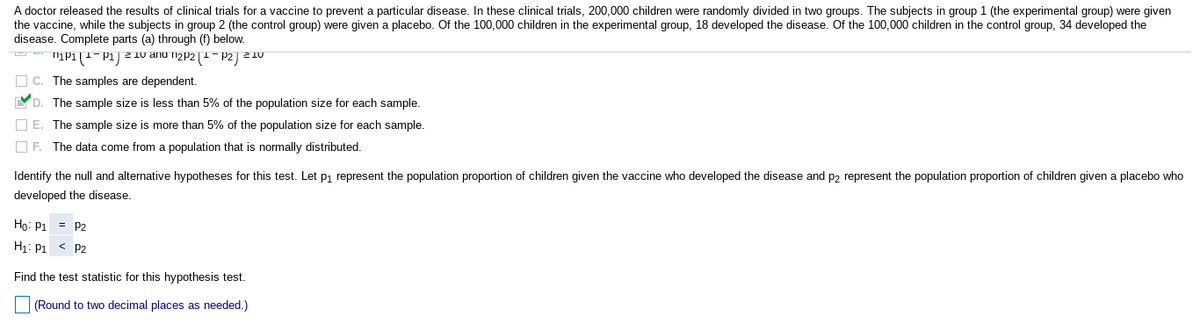
Transcribed Image Text:A doctor released the results of clinical trials for a vaccine to prevent a particular disease. In these clinical trials, 200,000 children were randomly divided in two groups. The subjects in group 1 (the experimental group) were given
the vaccine, while the subjects in group 2 (the control group) were given a placebo. Of the 100,000 children in the experimental group, 18 developed the disease. Of the 100,000 children in the control group, 34 developed the
disease. Complete parts (a) through (f) below.
IP1(1-P1) 2 10 anu izp2|1- P2) ²10
O C. The samples are dependent.
YD. The sample size is less than 5% of the population size for each sample.
O E. The sample size is more than 5% of the population size for each sample.
O F. The data come from a population that is normally distributed.
Identify the null and alternative hypotheses for this test. Let pi represent the population proportion of children given the vaccine who developed the disease and p2 represent the population proportion of children given a placebo who
developed the disease.
Ho: P1 = P2
H1: P1 < P2
Find the test statistic for this hypothesis test.
(Round to two decimal places as needed.)
Expert Solution
This question has been solved!
Explore an expertly crafted, step-by-step solution for a thorough understanding of key concepts.

This is a popular solution!

Trending now
This is a popular solution!

Step by step
Solved in 2 steps with 2 images

Knowledge Booster


Learn more about
Need a deep-dive on the concept behind this application? Look no further. Learn more about this topic, statistics and related others by exploring similar questions and additional content below.Recommended textbooks for you
Holt Mcdougal Larson Pre-algebra: Student Edition…
Algebra
ISBN:
9780547587776
Author:
HOLT MCDOUGAL
Publisher:
HOLT MCDOUGAL
Holt Mcdougal Larson Pre-algebra: Student Edition…
Algebra
ISBN:
9780547587776
Author:
HOLT MCDOUGAL
Publisher:
HOLT MCDOUGAL