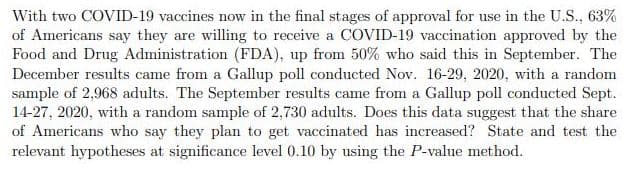
With two COVID-19 vaccines now in the final stages of approval for use in the U.S., 63% of Americans say they are willing to receive a COVID-19 vaccination approved by the Food and Drug Administration (FDA), up from 50% who said this in September. The December results came from a Gallup poll conducted Nov. 16-29, 2020, with a random sample of 2,968 adults. The September results came from a Gallup poll conducted Sept. 14-27, 2020, with a random sample of 2,730 adults. Does this data suggest that the share of Americans who say they plan to get vaccinated has increased? State and test the relevant hypotheses at significance level 0.10 by using the P-value method.
Q: It is hypothesized that regular exercise might help reduce the headaches. If a random sample of 206…
A: According to our guidelines we are solving only first three sub-parts of a question. Test : would…
Q: A double-blind randomized experiment compared the effects of the drug Lorcaserin and a placebo on…
A: Let μ1 be the average weight loss for treatment group and μ2 be the average weight loss for placebo…
Q: a) The county supervisor of Orange County with over 3 million adults wants to know what percentage…
A: The object is to collect an ideal sample and define an appropriate sampling method to study the…
Q: A company manufactures cell phone chargers. In August, a random sample of 200 chargers were…
A: Let X be the number of defectives from the binomial distribution with probability (p) = 3/200 and…
Q: The Ministry of Health Malaysia is interested in the post-shot side effects of a particular Covid-19…
A: One sample proportion test : The single proportion (or one-sample) binomial test compares a…
Q: This problem is based on information taken from The Merck Manual (a reference manual used in most…
A:
Q: Suppose that in a study of 35 million HPV shots examined, the shots were followed in time by 14,000…
A: 1. For the vaccinated group: Number of vaccinated individuals studied = 35 million = 35,000,000.…
Q: ngineer is performing a DoE including the the RF setting and it affects the etch rate, and she has…
A: The table given is shown below Observed Etch Rate RF power 1 2 3 4 5 160 575 542 530 539…
Q: In analyzing the consumption of cottage cheese by members of various occupational groups, the United…
A: Group 1 Group 2 Group 3 Total seldom or never 326 220 522 1068 often 511 269 721 1501 Total…
Q: I have attached a picture of the question.
A: Hello there! there are more than one question. According to our policies we cannot answer more than…
Q: Researchers sent out a survey to U.S. war veterans that asked a series of questions, including…
A: Given that nonsmokers were 27% more likely to respond to the survey within 30 days. If the study…
Q: A magazine conducted a random sample of 800 Americans and asked, "Should the federal tax on…
A:
Q: In order to assess the effects of exercise on reducing cholesterol, a researcher sampled 50 people…
A: Samples statistics are the parameters we obtain only through the samples we collect for the…
Q: A group of researchers wanted to determine if there was a difference in the predation habits of…
A: Given information: The data represents the values of the watering hole #1 and watering hole #2.
Q: Anita's, a fast-food chain specializing in hot dogs and garlic fries, keeps track of the proportion…
A: It is given that n=40 and p=0.52.
Q: A 2012 survey of 2247 American adults indicates that 16% of cell phone owners do their browsing on…
A: A z-test for two proportions is a hypothesis test that attempts to make a claim about the population…
Q: According to a certain government agency for a large country, the proportion of fatal traffic…
A: The sample size is 108, and population proportion is 0.36. Checking condition:…
Q: This problem is based on information taken from The Merck Manual (a reference manual used in most…
A:
Q: An organization published an article stating that in any one-year period, approximately 11.5 percent…
A:
Q: Elizon Pharmaceuticals, Inc., announced the results of its first human trial of NPI 32101, a topical…
A:
Q: 2. According to data released by the North Carolina Department of Health & Human Services, 1.795% of…
A: Let P^1 = The sample death rate of African Americans P2^ = The sample death rate of Caucasians…
Q: Is there a particular acid reflux drug that is more effective? To answer this question, we will use…
A: The test statistic is given below: χ2=∑Oi-Ei2Ei Here, Oi represents the observed values Ei…
Q: Anita's, a fast-food chain specializing in hot dogs and garlic fries, keeps track of the proportion…
A:
Q: In a clinical trial, 16 out of 861 patients taking a prescription drug daily complained of flulike…
A: Given that Sample size n = 861 Number of drug users experiencing flu like symptoms, X = 16 Level of…
Q: The National Institute of Mental Health published an article stating that in any one-year period,…
A: The hypotheses can be constructed as: Null hypothesis: H0: p = 0.095 Alternative hypothesis: H1: p…
Q: A consumer products testing group is evaluating two competing brands of tires, Brand 1 and Brand 2.…
A: State the test hypotheses. Consider Difference =Brand 1 – Brand 2. The claim is that mean tread wear…
Q: Two years ago the manager of a local supermarket that sells three national brands (brands A, B, and…
A: The test hypotheses are given below: H0: Pith Category observed=ptheorotical; i=1,2,...n H1: Pith…
Q: A study of “adverse symptoms” in users of over-the-counter pain relief medications assigned subjects…
A: To testH0:p1=p2H1:p1≠p2
Q: Anita's, a fast-food chain specializing in hot dogs and garlic fries, keeps track of the proportion…
A: Binomial Distribution : It describes the behavior of a count variable X if it has the following…
Q: The University is considering changing the email system that they currently use. Since there are…
A: We have to find null and alternative hypothesis for given data..
Q: A consumer products testing group is evaluating two competing brands of tires, Brand 1 and Brand 2.…
A: It is been asked to test whether the mean trend wear of brand 2 exceeds that of brand 1. The…
Q: Time magazine reported the result of a telephone poll of 800 adult Americans. The question posed of…
A: Given n1=605 n2=195 y1=351 y2=41
Q: The Ministry of Health Malaysia is interested in the post-shot side effects of a particular Covid-19…
A: The claim of the manufacture is that 50% of the second dose recipients developed mild side effects,…
Q: A researcher wants to determine if a new treatment is effective for reducing Ebola-related fever.…
A: The researcher is interested in examining the effectiveness of a new treatment in reducing…
Q: 4. A clinical trial is conducted to compare a new pain re- liever for arthritis to a placebo.…
A: Note: Since you have asked solution for question 4 specifically we will answer the same. In EXCEL,…
Q: Eighteen percent of U.S.-based multinational companies provide an allowance for personal…
A: From the given information, Eighteen percent of U.S.-based multinational companies provide an…
Q: Anita's, a fast-food chain specializing in hot dogs and garlic fries, keeps track of the proportion…
A: According to Anita's reports it is given that 52% of its customers order their food to go and a…
Q: For a two-factor ANOVA with two levels of factor A, two levels of factor B, and a separate sample of…
A: Given data n=8 The two means for level A1 are 3 and 5 The two means for level A2 are 4 and 2
Q: an automobile engineer claims that 1in 10 automobile accidents are due to driver fatigue . if a…
A: Given: P(Accidents are due to driver fatigue)=p=110=0.10Number of accidents observed =n=5
Q: Researchers studying the link between prenatal vitamin use and autism surveyed the mothers of a…
A: Given data: Autism Typical Development Total No Vitamin 111 70 181 Vitamin 143 159 302…
Q: A low-level CDC bureaucrat wants to please his boss by gathering evidence that the current…
A: Given information Sample mean x̅ = 99.2 Population mean µ = 127 Sample size n = 1600 Standard…
Q: 1. A researcher was interested in investigating the effectiveness of four different drugs and a…
A: Part a:Denote μP, μA, μB, μC, μD as the mean effects of the placebo, and Drugs A, B, C, D…
Q: The Ministry of Health Malaysia is interested in the post-shot side effects of a particular Covid-19…
A: IV) The level of significance is 0.05.
Q: In a clinical trial, 19 out of 864 patients taking a prescription drug daily complained of flulike…
A: The null hypothesis is set up to reject the claim that is inferred about a population parameter…
Q: I have attached the question as a picture. Please if you can section the question in its three parts…
A: Part a:Denote μP, μA, μB, μC, μD as the mean effects of the placebo, and Drugs A, B, C, D…
Q: Recent research findings have shown that older people who practice ballroom dancing are 77% less…
A: Two different samples, we need to use independent samples t test.
Q: A researcher notes that there seems to be a difference in the prevalence of individuals who are…
A: The null and the alternative hypotheses used for testing are, H0: Education level and health…
Q: Anita's, a fast-food chain specializing in hot dogs and garlic fries, keeps track of the proportion…
A: Given that n =40 , p =0.52
Q: A study was performed on 200 elementary school students to investigate whether regular Vitamin A…
A:
Step by step
Solved in 2 steps with 2 images
- What is meant by the sample space of an experiment?A low-level CDC bureaucrat wants to please his boss by gathering evidence that the current government mandated shut down of society is not causing people's mental health to deteriorate, so that it can safely be continued for several years if the expert says is necessary. He pulls a random sample of 1600 citizens, Gathering data on such items as income loss, weight gain, access to toilet paper, our spent binge watching Netflix, and number of injuries caused by household fight, and compiles all this into a significantly-weighted "misery index". The mean misery index from the sample is 99.2; it seems reasonable to use a population standard deviation o=19.1. A. Does this information provide significant evidence (at the 5% level) that the Nationwide mean misery index is less than 100? Set up appropriate null and alternative hypothesis, calculate the appropriate test statistic, find the p-value, and state your conclusion.In the search for a cure for the Coronavirus, it is important to determine what proportion of the population has antibodies, which would likely make them immune or less susceptible to the effects of the disease. According to an article in Politico published on April 26, 2022, 60% of Americans currently have detectible antibodies for Covid-19. A researcher thinks that more than 60% of Americans currently have antibodies for Covid-19. Suppose that the researcher takes a simple randomsample of 1200 Americans, tests their blood, and find that 750 of them have antibodies. Use a 0.05 significance level to test the researcher’s claim.
- A low-level CDC bureaucrat wants to please his boss by gathering evidence thatthe current government-mandated shutdown of society is not causing people’s mentalhealth to deteriorate, so that it can safely be continued for several years if anyexpert says it’s necessary.He polls a random sample of 1600 citizens, gathering data on such items asincome loss, weight gain, access to toilet paper, hours spent binge-watchingNetflix, and number of injuries caused by household fights, and compiles all thisinto a scientifically-weighted “misery index”.The mean misery index from the sample is 99.2; it seems reasonable to use apopulation standard deviation σ = 19.1.a) Does this information provide significant evidence (at the 5% level) that thenationwide mean misery index is less than 100? Set up appropriate null andalternative hypotheses, calculate the appropriate test statistic, find the P-value,and state your conclusion. (10)b) A CDC press release publishing the results of this study claims that…A low-level CDC bureaucrat wants to please his boss by gathering evidence thatthe current government-mandated shutdown of society is not causing people’s mentalhealth to deteriorate, so that it can safely be continued for several years if anyexpert says it’s necessary.He polls a random sample of 1600 citizens, gathering data on such items asincome loss, weight gain, access to toilet paper, hours spent binge-watchingNetflix, and number of injuries caused by household fights, and compiles all thisinto a scientifically-weighted “misery index”.The mean misery index from the sample is 99.2; it seems reasonable to use apopulation standard deviation σ = 19.1.a) Does this information provide significant evidence (at the 5% level) that thenationwide mean misery index is less than 100? Set up appropriate null andalternative hypotheses, calculate the appropriate test statistic, find the P-value,and state your conclusion. b) A CDC press release publishing the results of this study claims that…In a study of the effectiveness of a new device that supports a weak or damaged heart, 150 people who consented to treatment were assigned at random to either a standard treatment consisting of drugs or the experimental treatment that consisted of drugs and surgery to install the new device. After two years, 60% of the 67 patients who received the device had improved and 40% of the patients who received the standard treatment had improved. Does this data provide convincing evidence that the proportion of patients who recieved the experimental treatment who improved is higher than for the patients who received the standard treatment? Test the relevant hypotheses using a significance level of 0.05. (Use pexperimental − pstandard ).A) State the null and alternative hypotheses. H0: pe − ps = 0, HA: pe − ps ≠ 0 H0: pe − ps = 0, HA: pe − ps < 0 H0: pe − ps = 0, HA: pe − ps > 0 B) Find the test statistic.z = C) What is the p-value?P-Value = D) State your conclusion in terms of…
- Patients immobilized for a substantial amount of time can develop deep vein thrombosis (DVT), a blood clot in a leg or pelvis vein. DVT can have serious adverse health effects and can be difficult to diagnose. On its website, drug manufacturer Pfizer reports the outcome of a study looking at the effectiveness of the drug Fragmin (dalteparin) in preventing DVT in immobilized patients. Of the 1518 randomly chosen immobilized patients given Fragmin, 42 experienced a complication from DVT. Of the 1473 randomly chosen immobilized patients given a placebo, 73 experienced a complication from DVT. Compute the proportion (risk) of patients experiencing DVT complications for immobilized patients treated with Fragmin. (Enter the proportion with 4 decimal places. DO NOT enter the percent.)In randomized, double-blind clinical trials of a new vaccine, children were randomly divided into two groups. Subjects in group 1 received the new vaccine while subjects in group 2 received a control vaccine. After the second dose, 116 of 651 subjects in the experimental group (group 1) experienced fever as a side effect. After the second dose, 73 of 532 of the subjects in the control group (group 2) experienced fever as a side effect. Does the evidence suggest that a higher proportion of subjects in group 1 experienced fever as a side effect than subjects in group 2 at the α=0.10 level of significance? #1 Find the test statistic for this hypothesis test.In randomized, double-blind clinical trials of a new vaccine, infants were randomly divided into two groups. Subjects in group 1 received the new vaccine while subjects in group 2 received a control vaccine. After the second dose, 126 of 387 subjects in the experimental group (group 1) experienced drowsiness as a side effect. After the second dose, 158 of 574 of the subjects in the control group (group 2) experienced drowsiness as a side effect. Does the evidence suggest that a higher proportion of subjects in group 1 experienced drowsiness as a side effect than subjects in group 2 at the α=0.01 level of significance? Verify the model requirements. Select all that apply. A. The sample size is less than 5% of the population size for each sample. B. n1p11−p1≥10 and n2p21−p2≥10 C. The samples are dependent. D. The sample size is more than 5% of the population size for each sample. E. The samples are independent. F. The data come…
- A consumer advocacy group wanted to study whether different airline carriers differed in terms of their delayed flights. In particular, the researchers were interested in the relationship between p1, the proportion of Alpha Airlines flights that were delayed at least 15 minutes, and p2, the proportion of Beta Airlines flights that were delayed at least 15 minutes. A random sample of 1,000 Alpha flights and a separate random sample of 1,000 Beta flights found that 67 of the Alpha fights and 160 of the Beta flights were delayed at least 15 minutes. The conditions for inference were checked and verified. Does this set of samples provide strong evidence that Alpha Airlines has a smaller proportion of flights that are delayed at least 15 minutes than Beta Airlines, at the α = 0.05 significance level? Find the z-table here. A. The test statistic is z = –6.56 and the P-value ≈ 0. Since the P-value ≈ 0 < 0.05, there is not sufficient evidence that Alpha Airlines has fewer delayed…The manufacturer of a new racecar engine claims that the proportion of engine failures due to overheating for this new engine, (p1)(p1), will be no higher than the proportion of engine failures due to overheating of the old engines, (p2)(p2). To test this statement, NASCAR took a random sample of 165165 of the new racecar engines and 145145 of the old engines. They found that 1818 of the new racecar engines and 1212 of the old engines failed due to overheating during the test. Does NASCAR have enough evidence to reject the manufacturer's claim about the new racecar engine? Use a significance level of α=0.01α=0.01 for the test. Step 1 of 6 : State the null and alternative hypotheses for the test. Step 2 of 6: Find the vales of the two sample proportions P1 and P2.Round your answers three decimal places. Step 3 of 6: Compute the weighted estimate p. p(line above). Round your answers to three decimal places. Step 4 of 6: Compute the value of the test statistic. Round your answer to two…A consumer products testing group is evaluating two competing brands of tires, Brand 1 and Brand 2. Though the two brands have been comparable in the past, some technological advances were recently made in the Brand 2 manufacturing process, and the consumer group is testing to see if Brand 2 will outperform Brand 1. Tread wear can vary considerably depending on the type of car, and the group is trying to eliminate this effect by installing the two brands on the same random sample of 12 cars. In particular, each car has one tire of each brand on its front wheels, with half of the cars chosen at random to have Brand 1 on the left front wheel, and the rest to have Brand 2 there. After all of the cars are driven over the standard test course for 20,000 miles, the amount of tread wear (in inches) is recorded, as shown in Table 1. Car Brand 1 Brand 2 Difference(Brand 1 - Brand 2) 1 0.366 0.319 0.047 2 0.364 0.307 0.057 3 0.316 0.359 -0.043 4 0.277 0.298 -0.021 5…