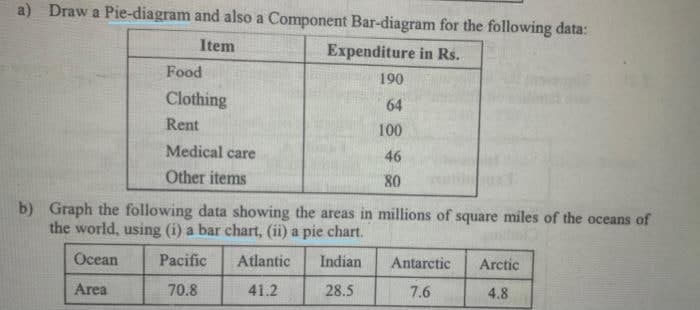
a) Draw a Pie-diagram and also a Component Bar-diagram for the following data: Item Expenditure in Rs. Food 190 Clothing 64 Rent 100 Medical care 46 Other items 80 b) Graph the following data showing the areas in millions of square miles of the oceans of the world, using (i) a bar chart, (ii) a pie chart. Ocean Рacific Atlantic Indian Antarctic Arctic Area 70.8 41.2 28.5 7.6 4.8
a) Draw a Pie-diagram and also a Component Bar-diagram for the following data: Item Expenditure in Rs. Food 190 Clothing 64 Rent 100 Medical care 46 Other items 80 b) Graph the following data showing the areas in millions of square miles of the oceans of the world, using (i) a bar chart, (ii) a pie chart. Ocean Рacific Atlantic Indian Antarctic Arctic Area 70.8 41.2 28.5 7.6 4.8

Glencoe Algebra 1, Student Edition, 9780079039897, 0079039898, 2018
18th Edition
ISBN:9780079039897
Author:Carter
Publisher:Carter
Chapter10: Statistics
Section10.6: Summarizing Categorical Data
Problem 33PPS

Related questions
Question
Transcribed Image Text:a) Draw a Pie-diagram and also a Component Bar-diagram for the following data:
Item
Expenditure in Rs.
Food
190
Clothing
64
Rent
100
Medical care
46
Other items
80
b) Graph the following data showing the areas in millions of square miles of the oceans of
the world, using (i) a bar chart, (ii) a pie chart.
Ocean
Pacific
Atlantic
Indian
Antarctic
Arctic
Area
70.8
41.2
28.5
7.6
4.8
Expert Solution
This question has been solved!
Explore an expertly crafted, step-by-step solution for a thorough understanding of key concepts.

Step by step
Solved in 3 steps with 4 images

Recommended textbooks for you
Glencoe Algebra 1, Student Edition, 9780079039897…
Algebra
ISBN:
9780079039897
Author:
Carter
Publisher:
McGraw Hill
Glencoe Algebra 1, Student Edition, 9780079039897…
Algebra
ISBN:
9780079039897
Author:
Carter
Publisher:
McGraw Hill