Random samples of 54 male students and 53 female students at the U of A were asked to state their car preference (American, European, and Japanese). The resulting frequencies are shown in the following table. Is there enough evidence to conclude a difference in car preference between males and females? American European Japanese Male 19 11 24 Female 13 20 20 (a) In performing this statistical test, state the hypotheses. O Ho: the distribution of gender is not the same for each car preference vs. Ha: the distribution of gender is the same for each car preference O Ho: the proportion of females is the same for each car preference vs. Ha: the proportion of females is not the same for each car preference O Ho: the distribution of preference is the same for males and females vs. HA: the distribution of preference is not the same for males and females O Họ: the proportion of males is the same for each car preference vs. HẠ: the proportion of males is not the same for each car preference O Ho: the distribution of preference is not the same for males and females vs. HA: the distribution of preference is the same for males and females (b) What is the expected frequencies of each cell? Fill out the table. (Round your answers to 2 decimal places, if needed.) American European Japanese Male 16.15 Female 21.79 (c) What is the test statistic value for this hypothesis test? (Round your answers to 2 decimal places, if needed.) TS =
Random samples of 54 male students and 53 female students at the U of A were asked to state their car preference (American, European, and Japanese). The resulting frequencies are shown in the following table. Is there enough evidence to conclude a difference in car preference between males and females? American European Japanese Male 19 11 24 Female 13 20 20 (a) In performing this statistical test, state the hypotheses. O Ho: the distribution of gender is not the same for each car preference vs. Ha: the distribution of gender is the same for each car preference O Ho: the proportion of females is the same for each car preference vs. Ha: the proportion of females is not the same for each car preference O Ho: the distribution of preference is the same for males and females vs. HA: the distribution of preference is not the same for males and females O Họ: the proportion of males is the same for each car preference vs. HẠ: the proportion of males is not the same for each car preference O Ho: the distribution of preference is not the same for males and females vs. HA: the distribution of preference is the same for males and females (b) What is the expected frequencies of each cell? Fill out the table. (Round your answers to 2 decimal places, if needed.) American European Japanese Male 16.15 Female 21.79 (c) What is the test statistic value for this hypothesis test? (Round your answers to 2 decimal places, if needed.) TS =

Holt Mcdougal Larson Pre-algebra: Student Edition 2012
1st Edition
ISBN:9780547587776
Author:HOLT MCDOUGAL
Publisher:HOLT MCDOUGAL
Chapter11: Data Analysis And Probability
Section: Chapter Questions
Problem 8CR

Related questions
Question
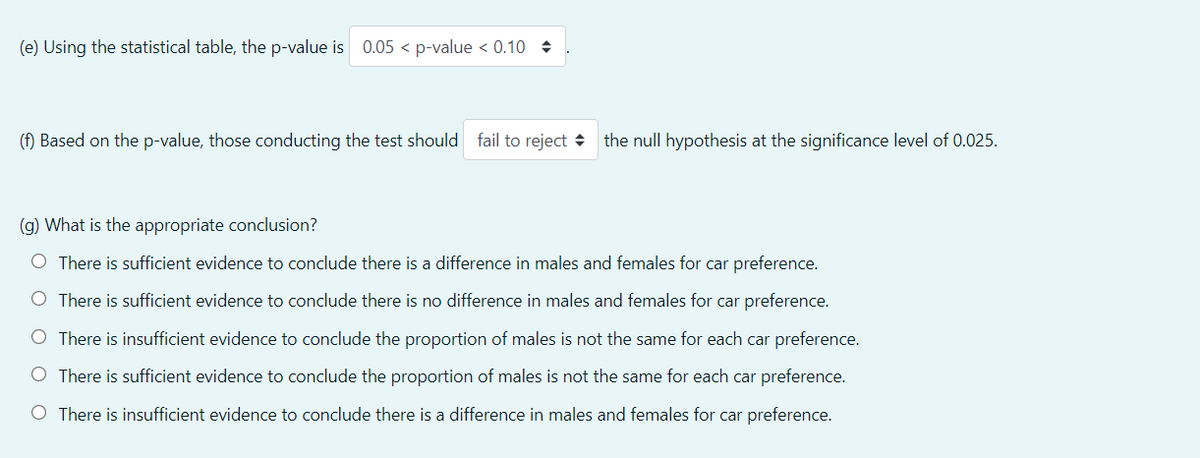
Transcribed Image Text:(e) Using the statistical table, the p-value is 0.05 < p-value < 0.10 +
(f) Based on the p-value, those conducting the test should fail to reject + the null hypothesis at the significance level of 0.025.
(g) What is the appropriate conclusion?
O There is sufficient evidence to conclude there is a difference in males and females for car preference.
O There is sufficient evidence to conclude there is no difference in males and females for car preference.
O There is insufficient evidence to conclude the proportion of males is not the same for each car preference.
O There is sufficient evidence to conclude the proportion of males is not the same for each car preference.
O There is insufficient evidence to conclude there is a difference in males and females for car preference.
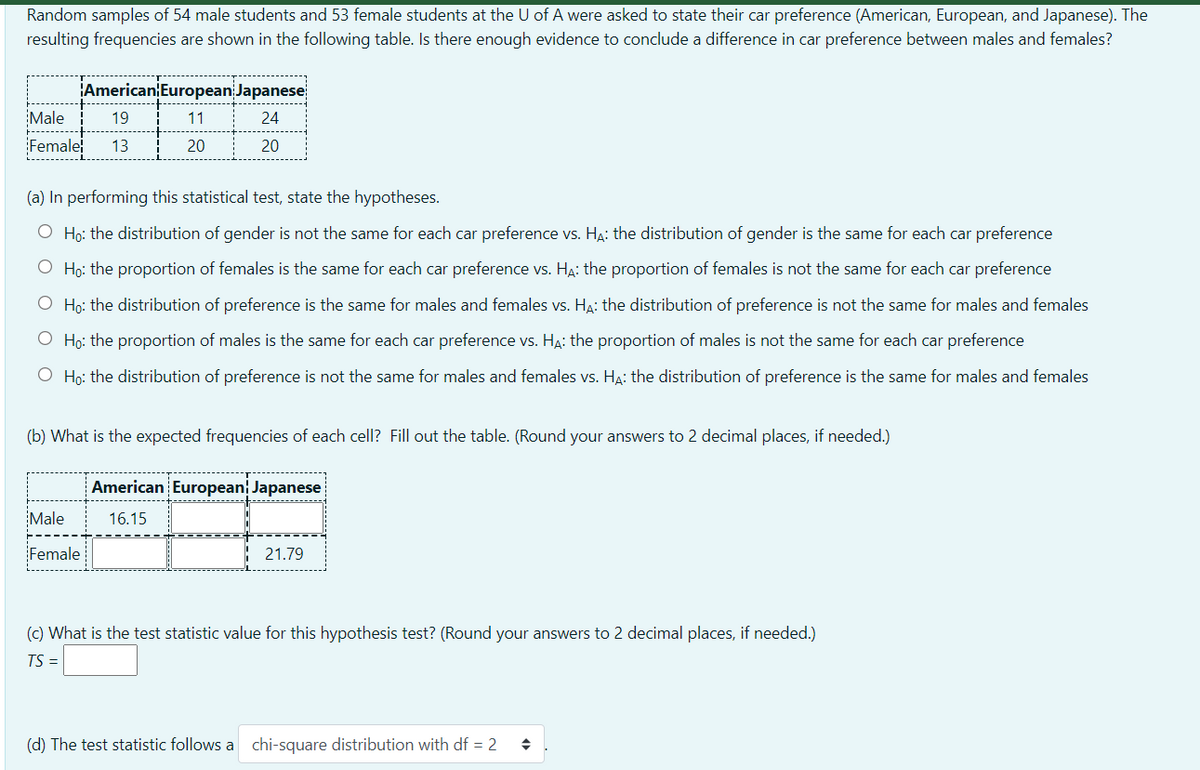
Transcribed Image Text:Random samples of 54 male students and 53 female students at the U of A were asked to state their car preference (American, European, and Japanese). The
resulting frequencies are shown in the following table. Is there enough evidence to conclude a difference in car preference between males and females?
American European Japanese
Male
19
11
24
Female
13
20
20
(a) In performing this statistical test, state the hypotheses.
O Ho: the distribution of gender is not the same for each car preference vs. H4: the distribution of gender is the same for each car preference
O Ho: the proportion of females is the same for each car preference vs. Ha: the proportion of females is not the same for each car preference
O Ho: the distribution of preference is the same for males and females vs. HA: the distribution of preference is not the same for males and females
O Họ: the proportion of males is the same for each car preference vs. HA: the proportion of males is not the same for each car preference
O Ho: the distribution of preference is not the same for males and females vs. HẠ: the distribution of preference is the same for males and females
(b) What is the expected frequencies of each cell? Fill out the table. (Round your answers to 2 decimal places, if needed.)
American European Japanese
Male
16.15
Female
21.79
(c) What is the test statistic value for this hypothesis test? (Round your answers to 2 decimal places, if needed.)
TS =
(d) The test statistic follows a chi-square distribution with df = 2
Expert Solution
This question has been solved!
Explore an expertly crafted, step-by-step solution for a thorough understanding of key concepts.

Step by step
Solved in 2 steps

Recommended textbooks for you
Holt Mcdougal Larson Pre-algebra: Student Edition…
Algebra
ISBN:
9780547587776
Author:
HOLT MCDOUGAL
Publisher:
HOLT MCDOUGAL
Holt Mcdougal Larson Pre-algebra: Student Edition…
Algebra
ISBN:
9780547587776
Author:
HOLT MCDOUGAL
Publisher:
HOLT MCDOUGAL