a) Draw a scatter diagram for the above data and interpret the relationship between the two variables. b) Calculate the product moment correlation coefficient between the birth weight and pregnancy age. Comment on the result obtained. c) Find the least squares regression equation.
a) Draw a scatter diagram for the above data and interpret the relationship between the two variables. b) Calculate the product moment correlation coefficient between the birth weight and pregnancy age. Comment on the result obtained. c) Find the least squares regression equation.

Glencoe Algebra 1, Student Edition, 9780079039897, 0079039898, 2018
18th Edition
ISBN:9780079039897
Author:Carter
Publisher:Carter
Chapter4: Equations Of Linear Functions
Section4.5: Correlation And Causation
Problem 24PFA

Related questions
Question
Do a, b, c.
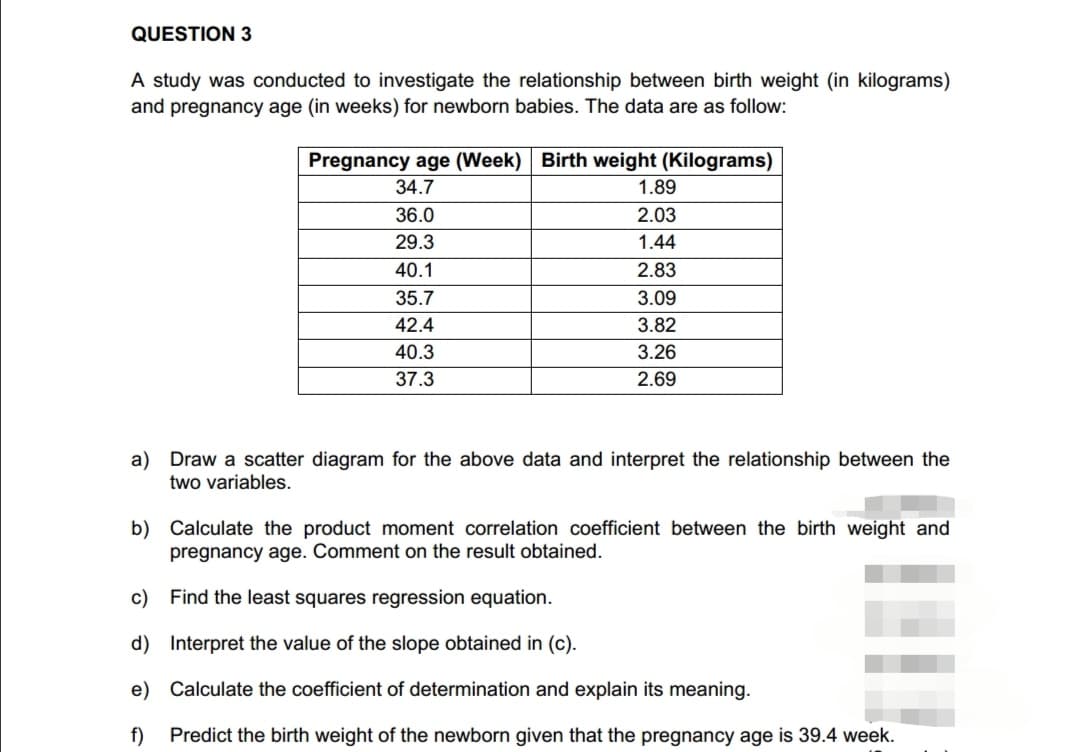
Transcribed Image Text:QUESTION 3
A study was conducted to investigate the relationship between birth weight (in kilograms)
and pregnancy age (in weeks) for newborn babies. The data are as follow:
Pregnancy age (Week) Birth weight (Kilograms)
34.7
36.0
29.3
40.1
35.7
42.4
40.3
37.3
1.89
2.03
1.44
2.83
3.09
3.82
3.26
2.69
a) Draw a scatter diagram for the above data and interpret the relationship between the
two variables.
b) Calculate the product moment correlation coefficient between the birth weight and
pregnancy age. Comment on the result obtained.
c)
Find the least squares regression equation.
d)
Interpret the value of the slope obtained in (c).
e) Calculate the coefficient of determination and explain its meaning.
f)
Predict the birth weight of the newborn given that the pregnancy age is 39.4 week.
Expert Solution
This question has been solved!
Explore an expertly crafted, step-by-step solution for a thorough understanding of key concepts.

Step by step
Solved in 2 steps with 4 images

Recommended textbooks for you
Glencoe Algebra 1, Student Edition, 9780079039897…
Algebra
ISBN:
9780079039897
Author:
Carter
Publisher:
McGraw Hill
Glencoe Algebra 1, Student Edition, 9780079039897…
Algebra
ISBN:
9780079039897
Author:
Carter
Publisher:
McGraw Hill