Answer to Problem 6TY The area under the standard normal curves between z = -2.165 and z = -1.35 is 0.0733. Explanation of Solution Given info: The mean and standard deviation of the standard normal distribution is 0 and 1. Calculation: Software procedure: Step-by-step procedure to obtain the area using the MINITAB software: • Choose Graph > Probability Distribution Plot choose View Probability > OK. • From Distribution, choose "Normal' distribution. • Click the Shaded Area tab. • Choose X Value and Middle for the region of the curve to shade. • Enter the X value 1 as-2.165 and X value 2 as -1.35. • Click OK. the MINITAR ftware below
Answer to Problem 6TY The area under the standard normal curves between z = -2.165 and z = -1.35 is 0.0733. Explanation of Solution Given info: The mean and standard deviation of the standard normal distribution is 0 and 1. Calculation: Software procedure: Step-by-step procedure to obtain the area using the MINITAB software: • Choose Graph > Probability Distribution Plot choose View Probability > OK. • From Distribution, choose "Normal' distribution. • Click the Shaded Area tab. • Choose X Value and Middle for the region of the curve to shade. • Enter the X value 1 as-2.165 and X value 2 as -1.35. • Click OK. the MINITAR ftware below

MATLAB: An Introduction with Applications
6th Edition
ISBN:9781119256830
Author:Amos Gilat
Publisher:Amos Gilat
Chapter1: Starting With Matlab
Section: Chapter Questions
Problem 1P

Related questions
Question
Hi,
Could you please explain how you found the answer for Z - 2.165. I tried to look it up using the standard normal distribution table but could not find the answer. Could you please advise how I can graph this on a TI-84 plus CE calculator. Thank you.
Transcribed Image Text:Answer to Problem 6TY
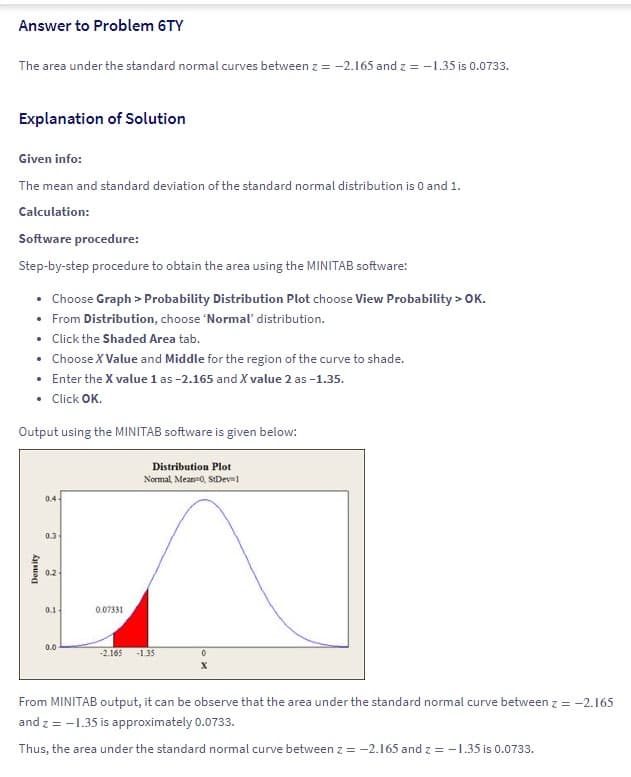
The area under the standard normal curves between z = -2.165 and z = -1.35 is 0.0733.
Explanation of Solution
Given info:
The mean and standard deviation of the standard normal distribution is 0 and 1.
Calculation:
Software procedure:
Step-by-step procedure to obtain the area using the MINITAB software:
• Choose Graph > Probability Distribution Plot choose View Probability > OK.
• From Distribution, choose "Normal' distribution.
• Click the Shaded Area tab.
• Choose X Value and Middle for the region of the curve to shade.
• Enter the X value 1 as-2.165 and X value 2 as -1.35.
• Click OK.
Output using the MINITAB software is given below:
Distribution Plot
Normal, Mean 0, StDev 1
Density
0.4-
0.3-
0.2
0.1-
0.0
0.07331
-2.165 -1.35
0
X
From MINITAB output, it can be observe that the area under the standard normal curve between z = -2.165
and z = -1.35 is approximately 0.0733.
Thus, the area under the standard normal curve between z = -2.165 and z = -1.35 is 0.0733.
Expert Solution
This question has been solved!
Explore an expertly crafted, step-by-step solution for a thorough understanding of key concepts.

This is a popular solution!

Trending now
This is a popular solution!

Step by step
Solved in 2 steps

Follow-up Questions
Read through expert solutions to related follow-up questions below.
Follow-up Question
From this screen, how do I enter the info? Typing exactly what you gave me resulted in the second image. Thank you.

Transcribed Image Text:fx > *
Σ
?
A
Q
Insert AutoSum Recently Financial Logical Text Date & Lookup &
Function
Used
NORM.S.D...
A
0.896298
1
2 DIST()
3
4
5
6
7
8
9
10
11
12
13
14
15
16
17
18
19
20
21
22
77
B
X
7
с
V
Function Library
fx
D
0
Math &
Time Reference Trig
=NORM.S.DIST()
E
Function Arguments
NORM.S.DIST
F
Formula result =
Help on this function
Z
Cumulative
G
...
More
Functions
H
Define Name
Fx Use in Formula *
Name
Manager Create from Selection
Defined Names
I
J
↑
↑
K
= number
= logical
=
Returns the standard normal distribution (has a mean of zero and a standard deviation of one).
Z is the value for which you want the distribution.
L
Trace Precedents
Trace Dependents
Remove Arrows
OK
M
Formula Auditing
?
Show Formulas
Error Checking ✓
Evaluate Formula
N
Cancel
X
O
EA
68
Watch
Windo
P

Transcribed Image Text:File
A1
1
2
3
4
5
fx Σ
0
Insert AutoSum Recently Financial Logical Text Date & Lookup & Math & More
Function
Used
Time Reference
Trig
Functions
6
7
8
9
10
11
Home Insert Page Layout Formulas Data Review View
12
13
A
0.896298
;
B
с
Function Library
fix
D
E
Help
F
=NORM.S.DIST(1.35,TRUE)- NORM.S.DIST(-2.165, TRUE)
G
Tell me what you want to do
H
Define Name
Use in Formula
Name
Manager Create from Selection
Defined Names
I
J
Book1 E
K
跟
L
Solution
Follow-up Question
How would I do this step by step in Excel? I went under statistics and norm s dist and still shows as invalid. Online calculators are no help. Thank you.
Solution
Recommended textbooks for you
MATLAB: An Introduction with Applications
Statistics
ISBN:
9781119256830
Author:
Amos Gilat
Publisher:
John Wiley & Sons Inc

Probability and Statistics for Engineering and th…
Statistics
ISBN:
9781305251809
Author:
Jay L. Devore
Publisher:
Cengage Learning

Statistics for The Behavioral Sciences (MindTap C…
Statistics
ISBN:
9781305504912
Author:
Frederick J Gravetter, Larry B. Wallnau
Publisher:
Cengage Learning
MATLAB: An Introduction with Applications
Statistics
ISBN:
9781119256830
Author:
Amos Gilat
Publisher:
John Wiley & Sons Inc
Probability and Statistics for Engineering and th…
Statistics
ISBN:
9781305251809
Author:
Jay L. Devore
Publisher:
Cengage Learning
Statistics for The Behavioral Sciences (MindTap C…
Statistics
ISBN:
9781305504912
Author:
Frederick J Gravetter, Larry B. Wallnau
Publisher:
Cengage Learning

Elementary Statistics: Picturing the World (7th E…
Statistics
ISBN:
9780134683416
Author:
Ron Larson, Betsy Farber
Publisher:
PEARSON

The Basic Practice of Statistics
Statistics
ISBN:
9781319042578
Author:
David S. Moore, William I. Notz, Michael A. Fligner
Publisher:
W. H. Freeman

Introduction to the Practice of Statistics
Statistics
ISBN:
9781319013387
Author:
David S. Moore, George P. McCabe, Bruce A. Craig
Publisher:
W. H. Freeman