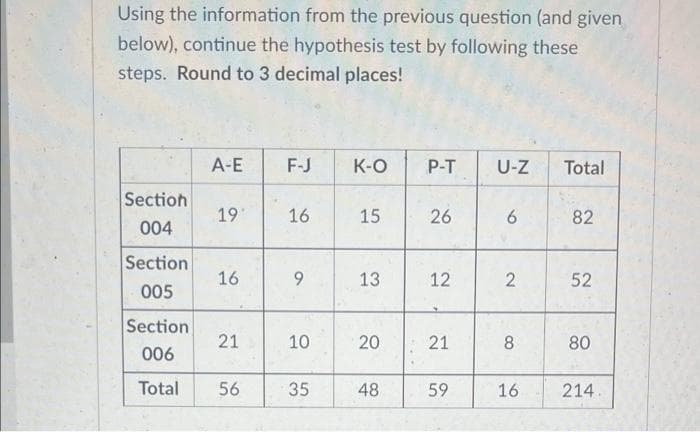
A-E F-J K-O P-T U-Z Total Section 19 16 15 26 6. 82 004 Section 16 13 12 52 005 Section 21 10 8 80 006 Total 56 35 48 59 16 214. 2. 21 20 9,


Q: If a person invests in the stock market and has a probability of 0.78 of winning $52,943 or a…
A: If a person invests in the stock market and has a probability of 0.78 of winning $52,943 or a…
Q: Student Math Test Score English Test Score 1 30 25 2 28 26 3 29 27 4 20 30 5 18 16 6 20 16 7 29 25 8…
A: a. The provided information is Student Math Test Score English Test Score Difference…
Q: II. Create a normal distribution and explain the test scores of the students in each particular…
A: For creating a normal distribution, we will require a random number generator. Since nothing is…
Q: The following is the frequency distribution for the speeds of a sample of automobiles traveling on…
A:
Q: (a) Let Y = 1/X. Specify the distribution of Y including parameters. (b) Find E[Y].
A:
Q: Create three examples of research title and write th null alternative hypothesis for each title
A: 1)We want to test whether the mean GPA of students in American colleges is different from 2.0 (out…
Q: Solution: Given: Claim: Math expression of the claim: Нypotheses Null hypothesis: Alternative…
A: Let p be the population proportion n be the sample size X be the number of people watch the game…
Q: 4. Instructors teaching research methods are interested in knowing what study techniques their…
A: Hello! As you have posted 2 different questions, we are answering the first question. In case you…
Q: Not everyone pays the same price for the same model of a car. The figure illustrates a normal…
A:
Q: Consider the following hypothesis test. Ho: H = 18 H3: u * 18 A sample of 48 provided a sample mean…
A:
Q: You are conducting a multinomial hypothesis test for the claim that the 4 categories occur with the…
A: Given that
Q: 3. Suppose a value is chosen “at random" in the interval [0,6]. In other words, x is an observed…
A:
Q: Need answers for questions 14, 19 and 21 only please Correlation and Simple Linear Regression V2…
A: Correlation Correlation analysis is a statistical way to determine the association between two…
Q: Instruction: For all test of hypotheses, write Ho and Ha in words, specify test procedure, show…
A: Wilk-Shapiro Test for Normality: Ho: The data values follows normal distribution. Ha : The data…
Q: The test statistic of z = - 2.88 is obtained when testing the claim that p# 0.375. This is a…
A: We have given that Test Statistics z = -2.88 Claim : p ≠ 0.375 (two tailed test) Significance level…
Q: Q3: The average number of bicycle accidents at on the road is 5 per week. 1- What is the probability…
A: The average no. of bicycle accidents on the road can be modeled using Poisson Distribution. i.e.,…
Q: The numbers of hours worked (per week) by 400 statistics students are shown below. Number of…
A: From the provided information, Number of Hours Frequency 0 ≤ x < 15 40 15 ≤ x…
Q: I. Creatively illustrate and explain the different properties of the standard normal curve. *Write…
A: The properties of the standard normal curve: 1. The Mean, Median, and Mode are all equal. 2. The…
Q: For Questions 21-20, assume the requirements needea for each calculation are satisjied. 21. The…
A: From the above data a)
Q: How much "statistical significance" do you need to feel confident in regression results? What could…
A: See below
Q: To estimate the population mean µ with a 85% error margin of 2.5 units, 10) one has determined that…
A:
Q: 10) An airline recorded the number of on-time arrivals for a sample of 100 flights each day. The…
A: The difference between the median and the lower quartile for the number of on-time arrivals is less…
Q: Consider the following 2-stage least squares regression output: . ivregress 2sls jail c.age##c.age…
A: It is a 2 stage least squares regression. Here the predicted value of compulsory defines a…
Q: Question 14 1) Listen You are given the following data set: 50.3 52.8 60.3 55.4 48.3 35.4 57.6…
A:
Q: 4. The moment-generating function of a random variable X is e8t – e4t M(t) t + 0, and M(0) = 1. 4t…
A: Find E(X), V(X) and P(4.5< X<7.5)=?
Q: temperatures (60 °C, ed. Upon checking, the s according to size. Dr s. The capsaicin conter in beloA
A: Given as, Sources of variation F p-value Size 2.1654 0.1560 Temperature 8.6013 0.0034
Q: d) Notice that to get smaller error and/or higher confidence, you need a larger sample. This result…
A: here use given information , standard deviation = s = 7.5hour
Q: 12. Which of the following is a Type I error? A. Ho is true; reject Ho. B. Ho is false; reject Ho.…
A: 12) The type I error is the probability of rejecting the null hypothesis when it is actually true.
Q: To test whether the mean time needed to mix a batch of material is the same for machines produced by…
A: For the given data Perform Anova single factor
Q: A company quality assurance officer wanted to estimate the mean number of defective syringes their…
A:
Q: Find P (1.23 <z <2.35)
A:
Q: Let X = U4) out of 8 standard ordered uniforms and Y = U(5) out of 8 standard ordered uniforms. 1.…
A: From the given information, X=U(4) out of 8 standard ordered uniform and Y=U(5) out of 8 standard…
Q: 3.) In the celebration of Teacher's Day. nine teachers were chosen and will be awarded. The District…
A: Given data :
Q: C. Find the 99% confidence interval for u. d. What conclusions can you make, based on each estimate?
A: Given that Sample size n =100 Sample mean =16 Variance =16 SD=4
Q: Consider the following sodium content of 26 randomly picked canned food. Propose ropriate data…
A: Given information: Sodium content of 26 randomly picked canned food. MINITAB Procedure: Choose Stat…
Q: A test on car braking reaction times for men between 18 and 30 years old have a produced a mean and…
A: For the given data Perform Z test for one mean
Q: Consider a birth and death process with birth rates 2¡ death rates µ¡ = iµ, i > 0. (i + 1)^, i > 0,…
A: Let us consider a general birth and death process with birth rates λi=i+1λ, i≥0 and death rates…
Q: Consider a binomial experiment with n trials for which the probability of a success on any given…
A:
Q: Of 9 available candidates for membership in a university committee, 5 are 4) (4 men and 4 are women.…
A:
Q: What is the
A: given samples: n=12 79, 82, 92, 84, 89, 95, 79, 82, 85, 87, 75, 79 HERE, Mean(x̄)=Σx/n= 1008/12 = 84…
Q: Do males or females feel more tense or stressed out at work? Asurvey of employed adults conducted…
A: Chi square test is used to understand the relationship between the two categorical variable. It is a…
Q: 11
A: Given: P[N<4]>0.95
Q: Determine what test statist. to use; c) Calculate the test statistic value. 1. Data from the school…
A: Given that Sample size n =50 Sample mean =164 Population standard deviation =1.5
Q: Consider the following regression estimate: In Qd = 2.1 – 0.7 ln P + 0.07Urban Log quantity demanded…
A: Given Information: Regression estimate ln Q^d=2.1-0.7 ln P+0.07Urban The dependent variable is…
Q: Consider the game of Nim (with normal play rules): (a) Consider piles position (3, 7) (i.e., two…
A:
Q: d. What is the probability that her trip will take exactly 50 minutes?
A: here given , The time it takes for Anna to travel between her home and her job is uniformly…
Q: Find the area, to the nearest thousandth, of the standard normal distribution between the given…
A: From the provided information, The z scores are as follow: z = 0 and z = 1.4
Q: A given distribution has a population mean, µ, of 106 and a population standard deviation, ơ, of 15.…
A: It is given that Mean = 106, SD = 15 And value x = 134
Q: You have a panel data set where 545 male workers are observed each year between 1980 and 1987. For…
A: From the above output we see that for the random-effects GLS regression group variable id: Value of…
Q: You may need to use the appropriate appendix table or technology to answer this question. Suppose in…
A: p=77%=0.77 X=171, n=300


Trending now
This is a popular solution!

Step by step
Solved in 2 steps

- Assuming all conditions for conducting a hypothesis test are met, what are the null and alternative hypotheses? A. H0: μ=60 seconds H1: μ≠60 seconds B. H0: μ=60 seconds H1: μ<60 seconds C. H0: μ=60 seconds H1: μ>60 seconds D. H0: μ≠60 seconds H1: μ=60 seconds Determine the test statistic. (Round to two decimal places as needed.) Determine the P-value. (Round to three decimal places as needed.)The label on a 4-quart container of orange juice states that the orange juice contains an average of 1 gram of fat or less. Answer the following questions for a hypothesis test that could be used to test the claim on the label. (a) Develop the appropriate null and alternative hypotheses. H0: ? > 1 Ha: ? ≤ 1 H0: ? < 1 Ha: ? ≥ 1 H0: ? ≤ 1 Ha: ? > 1 H0: ? = 1 Ha: ? ≠ 1 H0: ? ≥ 1 Ha: ? < 1 (b) What is the type I error in this situation? What are the consequences of making this error? It is claiming ? < 1 when it is not. This error would claim that the product is not meeting its label specification when it really is meeting its specification. It is claiming ? ≥ 1 when it is not. This error would miss the fact that the product is not meeting its label specification. It is claiming ? ≤ 1 when it is not. This error would miss the fact that the product is not meeting its label specification. It is claiming ? > 1 when it is not. This error would claim that the…An ad for a pest control company claims that 96% of their customers are 'extremely satisfied' with their service. A group of recent customers believes that figure is too high, and wish to conduct a hypothesis test at the α=0.05α=0.05 level of significance to determine if they are right. Which would be correct hypotheses for such a test? H0:p=0.96H0:p=0.96, H1:p<0.96H1:p<0.96 H0:p≠0.96H0:p≠0.96, H1:p=0.96H1:p=0.96 H0:p=0.96H0:p=0.96, H1:p>0.96H1:p>0.96 H0:p<0.96H0:p<0.96, H1:p=0.96H1:p=0.96 H0:p=0.96H0:p=0.96, H1:p≠0.96H1:p≠0.96 Which situation would represent a Type I error? Fail to reject the null hypothesis, which is actually false Reject the null hypothesis, which is actually false Reject the null hypothesis, which is actually true Fail to reject the null hypothesis, which is actually true If the resulting P-value is 0.024, which would be the appropriate conclusion? There is significant evidence to suggest that the actual proportion of satisfied…
- An ad for an artificial turf company claims that 92% of their customers are 'extremely satisfied' with their service. A group of recent customers believes that figure is too high, and wish to conduct a hypothesis test at the α=0.10α=0.10 level of significance to determine if they are right. Which would be correct hypotheses for this test? H0:p=0.92H0:p=0.92, H1:p>0.92H1:p>0.92 H0:p=0.92H0:p=0.92, H1:p<0.92H1:p<0.92 H0:p<0.92H0:p<0.92, H1:p=0.92H1:p=0.92 H0:p=0.92H0:p=0.92, H1:p≠0.92H1:p≠0.92 H0:p≠0.92H0:p≠0.92, H1:p=0.92H1:p=0.92 A random sample of 94 customers resulted in 85 that said they were 'extremely satisfied' with their service. Find the test statistic (Round to 2 decimals):Give the P-value (Round to 4 decimals - if less than 0.001 give answer as 0):The effectiveness of a new bug repellent is tested on 14 subjects for a 10 hour period. (Assume normally distributed population.) Based on the number and location of the bug bites, the percentage of surface area exposed protected from bites was calculated for each of the subjects. The results were as follows: x¯=93, ?=6 The new repellent is considered effective if it provides a percent repellency of at least 9090. Using ?=0.01, construct a hypothesis test with null hypothesis ?=90 and alternate hypothesis ?>90 to determine whether the mean repellency of the new bug repellent is greater than 9090 by computing the following: (a) the degrees of freedom (b) the test statisticThe effectiveness of a new bug repellent is tested on 25 subjects for a 10 hour period. (Assume normally distributed population.) Based on the number and location of the bug bites, the percentage of surface area exposed protected from bites was calculated for each of the subjects. The results were as follows: ?⎯⎯⎯=93, ?=12 The new repellent is considered effective if it provides a percent repellency of at least 91. Using ?=0.05, construct a hypothesis test with null hypothesis ?=91 and alternate hypothesis ?>91 to determine whether the mean repellency of the new bug repellent is greater than 91 by computing the following: (a) the degrees of freedom (b) the test statistic The final conclusion is A. We can reject the null hypothesis that ?=91. Our results indicate that the new bug repellent is effective.B. There is not sufficient evidence to reject the null hypothesis that ?=9. Our results do not provide enough evidence that the new bug repellent is effective.
- The label on a 3-quart container of orange juice states that the orange juice contains an average of 1 gram of fat or less. Answer the following questions for a hypothesis test that could be used to test the claim on the label. 1. What is the type I error in this situation? What are the consequences of making this error? A) It is claiming ? ≤ 1 when it is not. This error would miss the fact that the product is not meeting its label specification. B) It is claiming ? ≥ 1 when it is not. This error would miss the fact that the product is not meeting its label specification. C) It is claiming ? > 1 when it is not. This error would claim that the product is not meeting its label specification when it really is meeting its specification. D) It is claiming ? < 1 when it is not. This error would claim that the product is not meeting its label specification when it really is meeting its specification. #2 What is the type II error in this situation? What are the…Find the P-value for a left-tailed hypothesis test with a test statistic of z=−1.96. Decide whether to reject H0 if the level of significance is α=0.05.In 2002 a sta)s)cian named Fukuda found the following in Japan: Out of 565 births where both parents smoked more than a pack a day, 255 were boys. Out of 3602 births where both parents didn’t smoke, 1975 were boys. At ∝= 0.05, can we claim that there is a smaller propor)on of boys with parents who are smokers? Test using: a.) a hypothesis test b.) an appropriate CI
- An panelist on a morning news program recently claimed that 32% of drivers routinely drive while distracted by their smartphones. A statistician happened to be watching this program, and decided to conduct a hypothesis test at the α=0.01α=0.01 level of significance to determine if this is accurate. (Round your results to three decimal places)Which would be correct hypotheses for this test? H0:p≠0.32H0:p≠0.32, H1:p=0.32H1:p=0.32 H0:p<0.32H0:p<0.32, H1:p=0.32H1:p=0.32 H0:p=0.32H0:p=0.32, H1:p<0.32H1:p<0.32 H0:p=0.32H0:p=0.32, H1:p>0.32H1:p>0.32 H0:p=0.32H0:p=0.32, H1:p≠0.32H1:p≠0.32 A random sample of 176 drivers resulted in 151 that routinely drive while distracted by their smartphones. Find the test statistic (2 decimals):Give the P-value (4 decimals):The P-value for a hypothesis test is P = 0.034. Do you reject or fail to reject H 0 when the level of significance is α = 0.01?The P-value for a hypothesis test is 0.06. For each of the fol-lowing significance levels, decide whether the null hypothesis should be rejected. a. α = 0.05b. α = 0.10 c. α = 0.06


