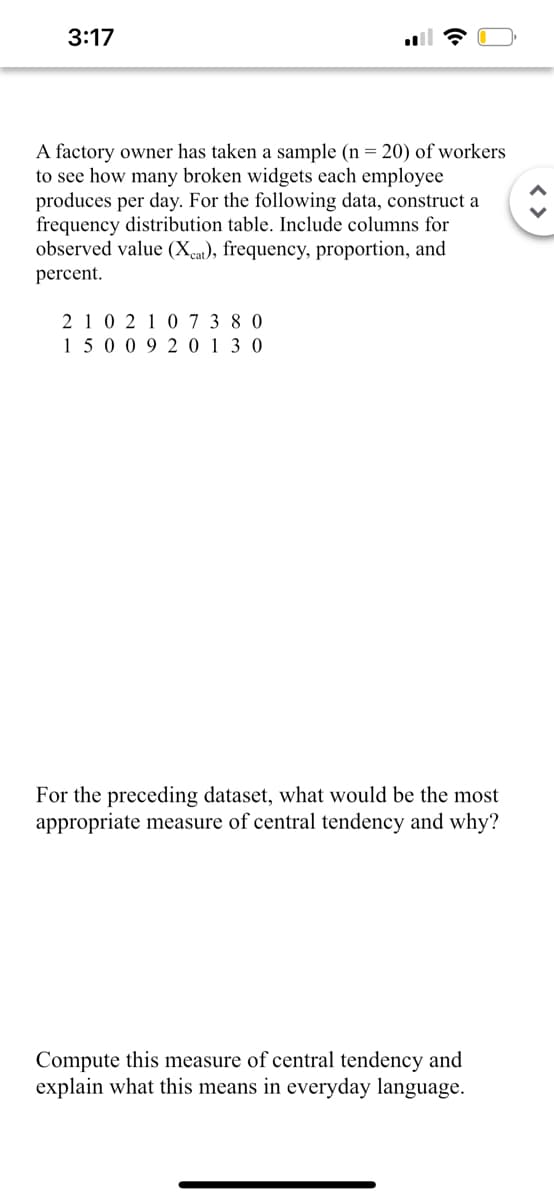
A factory owner has taken a sample (n = 20) of workers to see how many broken widgets each employee produces per day. For the following data, construct a frequency distribution table. Include columns for observed value (Xcat), frequency, proportion, and percent. 2102107380 1500920130 For the preceding dataset, what would be the most appropriate measure of central tendency and why? Compute this measure of central tendency and explain what this means in everyday language.
A factory owner has taken a sample (n = 20) of workers to see how many broken widgets each employee produces per day. For the following data, construct a frequency distribution table. Include columns for observed value (Xcat), frequency, proportion, and percent. 2102107380 1500920130 For the preceding dataset, what would be the most appropriate measure of central tendency and why? Compute this measure of central tendency and explain what this means in everyday language.
Glencoe Algebra 1, Student Edition, 9780079039897, 0079039898, 2018
18th Edition
ISBN:9780079039897
Author:Carter
Publisher:Carter
Chapter10: Statistics
Section10.4: Distributions Of Data
Problem 19PFA
Related questions
Question
100%
I need help understanding these problems

Transcribed Image Text:3:17
A factory owner has taken a sample (n = 20) of workers
to see how many broken widgets each employee
produces per day. For the following data, construct a
frequency distribution table. Include columns for
observed value (Xcat), frequency, proportion, and
percent.
210 210 7 3 8 0
15009 20130
For the preceding dataset, what would be the most
appropriate measure of central tendency and why?
Compute this measure of central tendency and
explain what this means in everyday language.
Expert Solution
This question has been solved!
Explore an expertly crafted, step-by-step solution for a thorough understanding of key concepts.
Step by step
Solved in 4 steps

Recommended textbooks for you

Glencoe Algebra 1, Student Edition, 9780079039897…
Algebra
ISBN:
9780079039897
Author:
Carter
Publisher:
McGraw Hill

Glencoe Algebra 1, Student Edition, 9780079039897…
Algebra
ISBN:
9780079039897
Author:
Carter
Publisher:
McGraw Hill