a) Figure 1 reports a scatter plot of hhinc (horizontal axis) and size (vertical axis). Do you see any correlation in the data? Can you conclude that a higher net income causes a higher home size? 400000 500000 300000 thine 100000 200000 Figure 1
a) Figure 1 reports a scatter plot of hhinc (horizontal axis) and size (vertical axis). Do you see any correlation in the data? Can you conclude that a higher net income causes a higher home size? 400000 500000 300000 thine 100000 200000 Figure 1

Managerial Economics: Applications, Strategies and Tactics (MindTap Course List)
14th Edition
ISBN:9781305506381
Author:James R. McGuigan, R. Charles Moyer, Frederick H.deB. Harris
Publisher:James R. McGuigan, R. Charles Moyer, Frederick H.deB. Harris
Chapter4A: Problems In Applying The Linear Regression Model
Section: Chapter Questions
Problem 5E

Related questions
Question
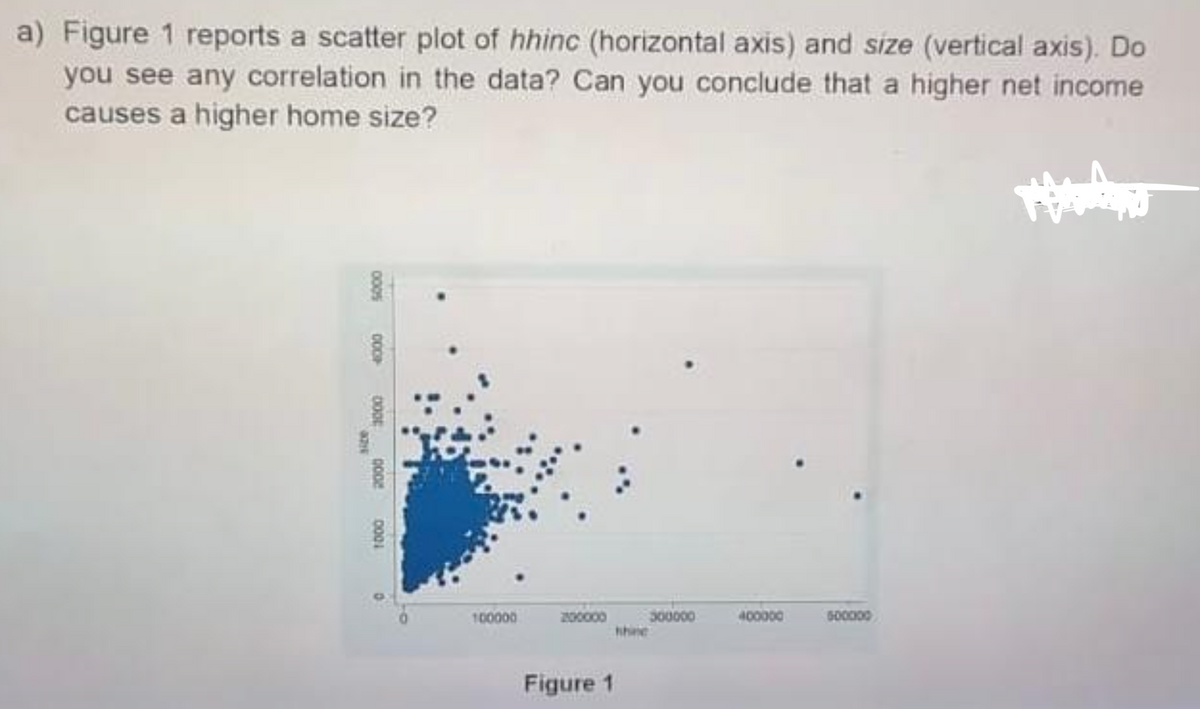
Transcribed Image Text:a) Figure 1 reports a scatter plot of hhinc (horizontal axis) and size (vertical axis). Do
you see any correlation in the data? Can you conclude that a higher net income
causes a higher home size?
300000
nhine
100000
200000
400000
Figure 1
000s
COOP
D001
Expert Solution
This question has been solved!
Explore an expertly crafted, step-by-step solution for a thorough understanding of key concepts.

Step by step
Solved in 2 steps

Recommended textbooks for you
Managerial Economics: Applications, Strategies an…
Economics
ISBN:
9781305506381
Author:
James R. McGuigan, R. Charles Moyer, Frederick H.deB. Harris
Publisher:
Cengage Learning


Managerial Economics: Applications, Strategies an…
Economics
ISBN:
9781305506381
Author:
James R. McGuigan, R. Charles Moyer, Frederick H.deB. Harris
Publisher:
Cengage Learning

