2- regression analysis is concerned with estimating .. Please select one; a) the mean of value of the fixed variable b) the mean value of the c) the mean value of the dependent variable d) the mean value of the correlation coefficient m
2- regression analysis is concerned with estimating .. Please select one; a) the mean of value of the fixed variable b) the mean value of the c) the mean value of the dependent variable d) the mean value of the correlation coefficient m

Managerial Economics: Applications, Strategies and Tactics (MindTap Course List)
14th Edition
ISBN:9781305506381
Author:James R. McGuigan, R. Charles Moyer, Frederick H.deB. Harris
Publisher:James R. McGuigan, R. Charles Moyer, Frederick H.deB. Harris
Chapter4A: Problems In Applying The Linear Regression Model
Section: Chapter Questions
Problem 2E

Related questions
Question
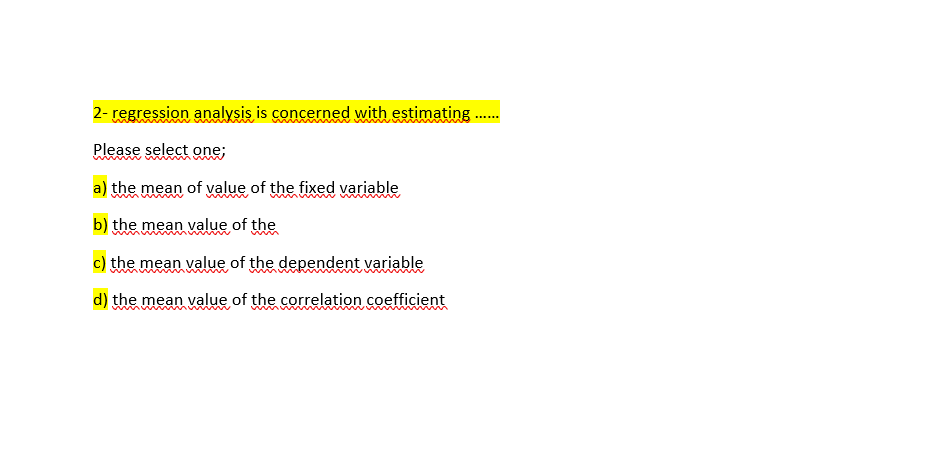
Transcribed Image Text:2- regression analysis is concerned with estimating .
Please select one;
a) the mean of value of the fixed variable
b) the mean value of the
c) the mean value of the dependent variable
d) the mean value of the correlation coefficient
Expert Solution
This question has been solved!
Explore an expertly crafted, step-by-step solution for a thorough understanding of key concepts.

This is a popular solution!

Trending now
This is a popular solution!

Step by step
Solved in 2 steps

Knowledge Booster


Learn more about
Need a deep-dive on the concept behind this application? Look no further. Learn more about this topic, economics and related others by exploring similar questions and additional content below.Recommended textbooks for you
Managerial Economics: Applications, Strategies an…
Economics
ISBN:
9781305506381
Author:
James R. McGuigan, R. Charles Moyer, Frederick H.deB. Harris
Publisher:
Cengage Learning
Managerial Economics: Applications, Strategies an…
Economics
ISBN:
9781305506381
Author:
James R. McGuigan, R. Charles Moyer, Frederick H.deB. Harris
Publisher:
Cengage Learning