We use the form 9-a + bx for the least-squares line. In some computer printouts, the least-squares equation is not given directly. Instead, the value of the constant a is given, and the coefficient b of the explanatory or predictor variable is displayed. Sometimes is referred to as the constant, and sometimes as the intercept. Data from a report showed the following relationship between elevation (in thousands of feet) and average number of frost-free days per year in a state. A Minitab printout provides the following information. SE Coef T P Predictor Constant Coef 315.27 28.31 11.24 0.002 Elevation -32.136 3.511 -8.79 0.003 $11.8603 R-Sq- 96.4 Notice that "Elevation" is listed under "Predictor." This means that elevation is the explanatory variable x. Its coefficient is the slope b. "Constant" refers to a in the equation 9-a + bx. (a) Use the printout to write the least-squares equation. + X (b) For each 1000-foot increase in elevation, how many fewer frost-free days are predicted? (Round your answer to three decimal places.) (c) The printout gives the value of the coefficient of determination 2. What is the value of r? Be sure to give the correct sign for r based on the sign of b. (Round your answer to four decimal places.) (d) What percentage of the variation in y can be explained by the corresponding variation in x and the least-squares line? What percentage is unexplained?
We use the form 9-a + bx for the least-squares line. In some computer printouts, the least-squares equation is not given directly. Instead, the value of the constant a is given, and the coefficient b of the explanatory or predictor variable is displayed. Sometimes is referred to as the constant, and sometimes as the intercept. Data from a report showed the following relationship between elevation (in thousands of feet) and average number of frost-free days per year in a state. A Minitab printout provides the following information. SE Coef T P Predictor Constant Coef 315.27 28.31 11.24 0.002 Elevation -32.136 3.511 -8.79 0.003 $11.8603 R-Sq- 96.4 Notice that "Elevation" is listed under "Predictor." This means that elevation is the explanatory variable x. Its coefficient is the slope b. "Constant" refers to a in the equation 9-a + bx. (a) Use the printout to write the least-squares equation. + X (b) For each 1000-foot increase in elevation, how many fewer frost-free days are predicted? (Round your answer to three decimal places.) (c) The printout gives the value of the coefficient of determination 2. What is the value of r? Be sure to give the correct sign for r based on the sign of b. (Round your answer to four decimal places.) (d) What percentage of the variation in y can be explained by the corresponding variation in x and the least-squares line? What percentage is unexplained?

Algebra & Trigonometry with Analytic Geometry
13th Edition
ISBN:9781133382119
Author:Swokowski
Publisher:Swokowski
Chapter7: Analytic Trigonometry
Section7.6: The Inverse Trigonometric Functions
Problem 94E

Related questions
Question
Help me answer all parts of this question
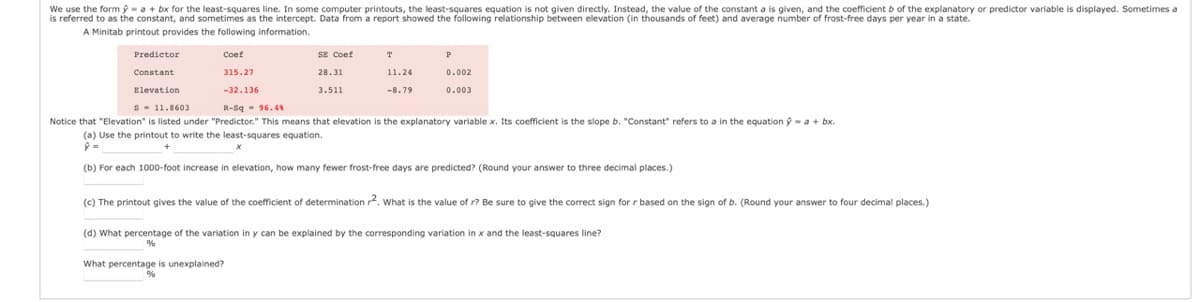
Transcribed Image Text:We use the form ý= a + bx for the least-squares line. In some computer printouts, the least-squares equation is not given directly. Instead, the value of the constant a is given, and the coefficient b of the explanatory or predictor variable is displayed. Sometimes a
is referred to as the constant, and sometimes as the intercept. Data from a report showed the following relationship between elevation (in thousands of feet) and average number of frost-free days per year in a state.
A Minitab printout provides the following information.
SE Coef
T
Predictor
Constant
Coef
315.27
28.31
11.24
0.002
Elevation
-32.136
3.511
-8.79
0.003
s
11.8603
R-Sq 96.4%
Notice that "Elevation" is listed under "Predictor." This means that elevation is the explanatory variable x. Its coefficient is the slope b. "Constant" refers to a in the equation = a + bx.
(a) Use the printout to write the least-squares equation.
ŷ=
+
(b) For each 1000-foot increase
elevation, how many fewer frost-free days are predicted? (Round your answer to three decimal places.)
(c) The printout gives the value of the coefficient of determination 2. What is the value of r? Be sure to give the correct sign for r based on the sign of b. (Round your answer to four decimal places.)
(d) What percentage of the variation in y can be explained by the corresponding variation in x and the least-squares line?
%
What percentage is unexplained?
Expert Solution
This question has been solved!
Explore an expertly crafted, step-by-step solution for a thorough understanding of key concepts.

Step by step
Solved in 5 steps with 2 images

Recommended textbooks for you
Algebra & Trigonometry with Analytic Geometry
Algebra
ISBN:
9781133382119
Author:
Swokowski
Publisher:
Cengage

Linear Algebra: A Modern Introduction
Algebra
ISBN:
9781285463247
Author:
David Poole
Publisher:
Cengage Learning

Glencoe Algebra 1, Student Edition, 9780079039897…
Algebra
ISBN:
9780079039897
Author:
Carter
Publisher:
McGraw Hill
Algebra & Trigonometry with Analytic Geometry
Algebra
ISBN:
9781133382119
Author:
Swokowski
Publisher:
Cengage
Linear Algebra: A Modern Introduction
Algebra
ISBN:
9781285463247
Author:
David Poole
Publisher:
Cengage Learning
Glencoe Algebra 1, Student Edition, 9780079039897…
Algebra
ISBN:
9780079039897
Author:
Carter
Publisher:
McGraw Hill

Functions and Change: A Modeling Approach to Coll…
Algebra
ISBN:
9781337111348
Author:
Bruce Crauder, Benny Evans, Alan Noell
Publisher:
Cengage Learning