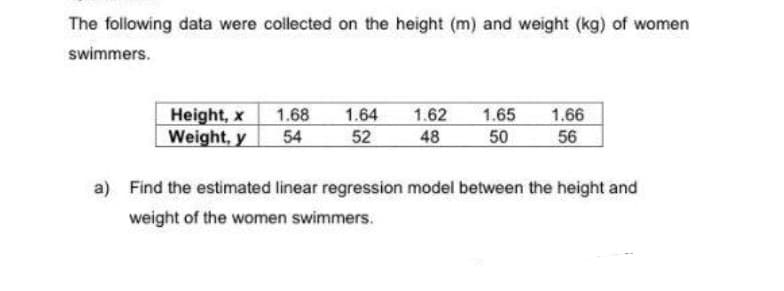
a) Find the estimated linear regression model between the height and weight of the women swimmers.


Q: first year college students were selected with their grades in Grade 12 Math and Math in the Modern…
A: Here we are given x…
Q: For a linear regression b1 is the estimated y-intercept, and b0 is the estimated slope of the…
A: Regression equation is : y=b0+b1x
Q: For Exercise, use the scatter plot to determine if a linear regression model appears to be…
A: Scatter Plot Diagrams: If data is given in pairs then the scatter plot diagram of the data is just…
Q: A statistics consulting center at a major university analyzed data on normal woodchucks for the…
A: From the table: n=19 ∑y=59060 ∑xy=753559.5∑x=244.2 ∑x2=3212.36
Q: The equation used to predict annual cauliflower yield (in pounds per acre) is y = 23,482 +4.455x,…
A: Given that the regression equation is, y^=23,482+4.455x1-4.602x2 a) Given that x1=37000 and…
Q: For a linear regression b1 is the estimated y-intercept, and b0 is the estimated slope of the…
A:
Q: explain the following Linear Regression Analysis 1. Straight Line Model 2. The Method of Least…
A: Linear Regression Analysis : Linear regression analysis is a statistical technique for predicting…
Q: Using empirical data, a researcher developed a linear regression model of Ỹ = 65 + 0.9x1 – 0.5x2 %3D…
A:
Q: Develop the estimated regression equation by computing the values of bo and b. Use the estimated…
A: We have to calculate the estimated regression line and predict the value of y when x = 4
Q: What are the interpretations of the Y-intercept and the slope in a simple linear regression model?
A: In multiple linear regression, there will be more than one independent variable. In simple linear…
Q: Suppose the regression model is estimated as follow: Y(hat) = 2475.8 - 114.378 X, - 107.585 X 21 +…
A: Given information: The regression output is given.
Q: Construct the equation of the regression line. The following table lists the age of a cow (in years)…
A: The regression equation is, y⏞ = b*X +a Where, b =Σ(x-x)*(y-y)Σ(x-x)2a= y¯-b*x
Q: An organization collects information on the life expectancy (in years) of a person in certain…
A: Using Excel to find the best fit linear regression question.The steps are given below:Enter the data…
Q: In the equation of a linear regression, Y = b¡X + bo , if b1 = -1.4 which means %3D
A: Given information: Linear regression equation is, Y=b1X+b0, if b1=-1.4 Therefore, the regression…
Q: Construct the simple linear regression equation of Y on X if n = 7, £x, =113, Ex=1983, y,-182 and…
A: Givenn=7∑xi=113i=1n∑i=1nxi2=1983∑yi=182i=1n∑i=1nxiyi=3186
Q: ..... The equation of the regression line is y = x+
A: Given : X Y 20 2.67 18 3.22 17 2.69 16 3.71 14 3.83 12 4.43 11 3.76 9 5.18
Q: The equation used to predict annual cauliflower yield (in pounds per acre) is y = 23,684 + 4.548x, -…
A: Given,equation is y^=23,684+4.548x1-4.744x2
Q: 1) What are the assumptions of a simple linear regression model.
A: In simple linear regression there will be only one independent variable. In multiple linear…
Q: In the equation of a linear regression, Y = b¡X + bo , if b1 = -4.7 which means %3D %3D
A: Since , the regression equation is , Y=b1X+b0 Given that b1=-4.7 We want to find the correct…
Q: When a regression coefficient in a multiple linear regression model is zero, the slope of the…
A: #When a regression coefficient in a multiple linear regression model is zero, the slope of the…
Q: 4. Scientists have studied the factors that affect the wind speed of hurricanes, and they have…
A:
Q: A shoe store developed the following estimated regression equation relating sales to inventory…
A: Given, y^ = 25+12x1+7x2 Where, x1 = inventory investment ($1000s) x2 = advertising…
Q: Which variables is/are included in the best set of the model using stepwise regression? a. x1 b.…
A: P-value for variable X2 is 0.075 which is greater than 0.05 so it is not statistically significant.…
Q: The table contains data on vehicle speed (h) and fuel consumption (It / 100km) of 5 randomly…
A: Let x be the speed and y be the consumption. Then, the regression equation is y=a+bx.
Q: A professor in the School of Business in a university polled a dozen colleagues about the number of…
A:
Q: An automotive engineer studied the effect of car weight in tons on fuel efficiency, which is…
A: Since the relation between efficiency and weight follows the linear model, we can use formula for…
Q: (c) Use the least squares method to develop the estimated regression equation. シ= (d) Predict the…
A: Regression Equation : Regression analysis is used to measures the association or linear relationship…
Q: (a) Fit a multiple linear regression model to the data. (b) Predict HFE (y) when x1 = 14.5, x2 =…
A: 2. (a) The regression analysis is conducted using EXCEL. The software procedure is given below:…
Q: An organization collects information on the life expectancy (in years) of a person in certain…
A: Regression:In order to obtain the least square regression line, first perform regression analysis on…
Q: Determine the best (according to sum-of-squares-measure) curve y = Aebx , through the data above.…
A: According to the given information, it is required to find the curve of the form y=Aebx from the…
Q: For a linear regression b1 is the estimated y-intercept, and b0 is the estimated slope of the…
A: The general form of linear regression equation is, y=b0+b1x
Q: The equation of the linear regression line is: ˆyy^ = Incorrect + Incorrectxx (Please show your…
A: Let Y denotes the seeds produced and X denotes the sprout percent.
Q: Construct the equation of the regression line. The following table lists the age of a cow (in years)…
A: Find Regression line equations from the following data X Y 4 37 4 35.4 6 33.3 7 33.1 7…
Q: Suppose that you have created a linear regression model ŷ = bo + bị x , where Sy = 2.0, b1 =-2.00,…
A: The value of sy is 2.0, b1 is -2.00 and sx is 0.5.
Q: elate dala Del , of a linear model represents how the two types of data change i value.
A: The answer is given below
Q: If we estimate a linear regression of a variable Y on X and find a slope coefficient equal to 1,…
A: Given: Slope coefficient between regression of y on x is b1=1 b1=cov(x,y)/var(x) #…
Q: The volume (in cubic feet) of a black cherry tree can be modeled by the equation y = - 50.7 +0.4x,…
A: Hi! Thank you for the question, As per the honor code, we are allowed to answer three sub-parts at a…
Q: The equation used to predict annual cauliflower yield (in pounds per acre) is y = 24,677 + 4.556x, -…
A: The regression equation is given as,
Q: 7. Which of the following equations may be analyzed using the linear regression method and explain…
A: The answer is in the next step
Q: How to interpret these values for a logistical regression model?
A: Consider the given output that shows the summary statistics.
Q: A numerical quantity that measures the strength of the linear relationship between two variables is…
A:
Q: a) What is dependent and independent variables? b) Fully write out the regression equation c) Fill…
A: a) Dependent variable: The variable that is changed because of the influence of the independent…
Q: In the simple linear regression equation,the term b1 represents the A)estimated intercept…
A: The simple regression equation is y=b0+b1x where, y is the Response Variable b0 is the estimated…
Q: (a) Determine Sr. Syy. and Szy (b) Determine Bo, B. (c) Determine the estimated regression line…
A:
Q: A study examined the eating habits of 20 children at a nursery school. The variables measured for…
A:
Q: The volume (in cubic feet) of a black cherry tree can be modeled by the equation y = - 50.7 + 0.4x,…
A: To Calculate predicted values, we've to put the values of X1 and X2 in the given equation.…
Q: Anthropologists who study skeletal remains can predict a woman's height just from the length of her…
A: topic- coordinate geometry y axis usually represents dependent variable
Q: a person should exercise per week (Y), given their age (x1) and the number of calories they eat per…
A: Given information: y ( dependent variable ) = number of hours person should exercise per week…

Step by step
Solved in 2 steps with 2 images

- The table contains data on vehicle speed (h) and fuel consumption (lt / 100km) of 5 randomly selected vehicles. Estimate the average fuel consumption of a vehicle traveling at 45 km / h using the simple linear regression equation between vehicle speed and fuel consumption. Speed 55 60 65 70 75 Consumption 13 12 11 10 9 a. 15 b. 8 c. 7 d. 20The marketing manager of a supermarket chain would like to determine the effect of shelf spaceon the sales of pet food. A random sample of 10 stores was selected, and the results are presentedbelow. Store shelf space in cm weekly sales in thousand pesos 1 45 18 2 45 21 3 75 15 4 80 18 5 95 23 6 100 26 7 135 22 8 140 27 9 185 25 10 190 28 d. Using the estimated simple linear regression equation Y=15.6414+0.0611X, estimate the weekly sales when theshelf space is 230cm? 250cm? e. Compute the coefficient of determination and interpret its value.Use the following table to find the equation of the regression line, between x and y x312304y210342
- The following table shows the annual expenditures, in dollars, per customer unit for residential landline phone services and cellular phone services in the United States in the given year.† Year Landline Cell 2004 592 378 2006 542 524 2008 467 643 2010 401 760 Calculate the regression line for each type of service. (Let t be the time in years since 2004, L be the operating revenue of landline phone services and C be the expenditure of cellular services. Round your regression parameters to two decimal places.) L(t) = C(t) = Determine the expenditure level at which the two lines cross. Round your answer for the expenditure level to one decimal place. million dollarsWhich of the following does not need to be computed to determine a simple regression line? SSx SP "Y-hat" SSyThe following table displays the mathematics test scores for a random sample of college students, along with their final SY16C grades. a. Fit the regression line y = a+bx to the data and interpret the results. b. Use the regression equation to determine the SY16C grade for a college student who scored60 on their achievement test. What would their SY16C grade be?
- A U.S. state's Bureau of Economic Geology published a study on the economic impact of using carbon dioxide enhanced oil recovery (EOR) technology to extract additional oil from fields that have reached the end of their conventional economic life. The following table gives the approximate number of jobs for the citizens that would be created at various levels of recovery. Percent Recovery (%) 20 40 80 100 Jobs Created (Millions) 6 9 12 18 Find the regression line. j(r) = Use the regression line to estimate the number of jobs that would be created at a recovery level of 60%. _____ million jobsThe following are data on the average weekly profits(in $1,000) of five restaurants, their seating capacities, andthe average daily traffic (in thousands of cars) that passestheir locations: Seating Traffic Weekly netcapacity count profitx1 x2 y120 19 23.8200 8 24.2150 12 22.0180 15 26.2240 16 33.5 (a) Assuming that the regression is linear, estimate β0, β1,and β2.(b) Use the results of part (a) to predict the averageweekly net profit of a restaurant with a seating capacityof 210 at a location where the daily traffic count averages14,000 cars.The following table displays the mathematics test scores for a random sample ofcollege students, along with their final SY16C grades.a. Fit the regression line y=a+bx to the data and interpret the results.b. Use the regression equation to determine the SY16C grade for a college student whoscored 60 on their achievement test. What would their SY16C gradebe? Mathematics test(x) SY16C grades(y)1 39 652 43 783 21 524 64 825 57 926 47 897 28 738 75…
- The following estimated regression model was developed relating yearly income (y in $1000s) of 30 individuals with their age (x1) and their gender (x2) (0 if male and 1 if female).ŷ = 30 + 0.7x1 + 3x2Also provided are SST = 1200 and SSE = 384.The yearly income of a 24-year-old female individual is _____.Use the table of x and y values below to determine the slope of the least-squares regression line.The table contains data on vehicle speed (h) and fuel consumption (lt / 100km) of 5 randomly selected vehicles. Estimate the average fuel consumption of a vehicle traveling at 45 km / h using the simple linear regression equation between vehicle speed and fuel consumption. Speed 55 60 65 70 75 Consumption 11 10 9 8 7 Please choose one: a. 6 b. 5 c. 13 D. 8