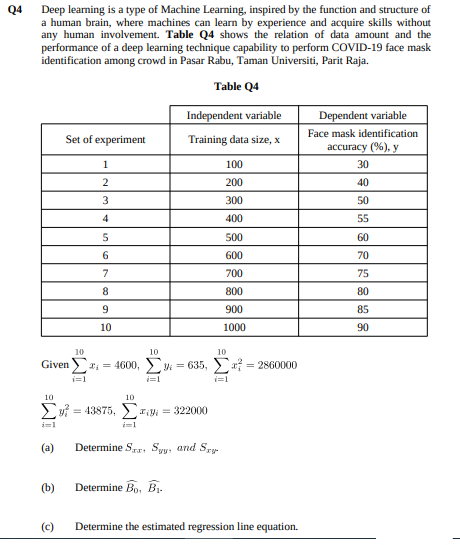
(a) Determine Sr. Syy. and Szy (b) Determine Bo, B. (c) Determine the estimated regression line equation.


Q: first year college students were selected with their grades in Grade 12 Math and Math in the Modern…
A: Here we are given x…
Q: A set of X and Y scores Mx=4, SSx=10, My=5, SSy=40, SP=20. What is the regression equation for…
A: Given that xbar = 4, SSx = 10, ybar = 5, SSy = 40, SSp = 20.The equation of a regression line is…
Q: Select all the charts that violate the conditions for linear regression. (a) (b) (c)
A: Assumptions of linear regression are as follows: Terms should be normally distributed. There must…
Q: The yield of a grain, Y (/ha), appears to be linearly related to the amount of fertilizer applied, X…
A: Given information: The regression equation is as given below: Yield = 4.85 + 0.05*fertilizer.
Q: (a) Find the equation of the regression line for the given data, letting Row 1 represent the…
A:
Q: For the linear regression equation, Y = bX + a, which of the following X, Y points will definitely…
A: We have given the linear regression equation- Y = bX + a To know which points will be on the…
Q: A set of X and Y scores has MX = 3, SSX = 5, MY = 4, SSY = 30, and SP = 10. What is the regression…
A: According to the provide information,
Q: Draw the regression line for the following equation: Y = -3 + (1) X
A: The regression line is given as follows Y = -3 + X
Q: The table below shows the number of state-registered automatic weapons and the murder rate for…
A: Given X=6.5
Q: Find b0 and b1 and derive the regression line equation for the data below: x y 0 2 1 3 2 5 3 7 4 10…
A: From given data, X Y X*Y X*X 0 2 0 0 1 3 3 1 2 5 10 4 3 7 21 9 4 10 40 16…
Q: Different hotels in a certain area are randomly selected, and their ratings and prices were…
A: Given: Slope = 120 Intercept = -354
Q: A set of X and Y scores has MX=4, SSX=10, MY=5, SSY=40 and SP=20. What is the regression equation…
A: The given values are, The value of slope is,
Q: a) The grades of a class of 9 students on a mid term report(X) and the final examination(Y) are as…
A: (a) Let X denote the Mid term report Let Y denote the final examination Calculation: From the…
Q: The grades of a class of 9 students on a midterm report (x) and on the final examination (y) are as…
A: (a). Let X denote the Mid term report Let Y denote the final examination Calculation :…
Q: ..... The equation of the regression line is y = x+
A: Given : X Y 20 2.67 18 3.22 17 2.69 16 3.71 14 3.83 12 4.43 11 3.76 9 5.18
Q: Find the equation of the regression line for the given data. -5 -3 4 -1 -2 3 11 -6 3 -4 -5 8. =…
A: The regression equation for one independent variable is, From the given information, Let X…
Q: The following data set shows the entrance exam score (Verbal GMAT) for each of eight MBA students…
A: Given, The following data set shows the entrance exam score (Verbal GMAT) for each of eight MBA…
Q: The admissions officer for a certain college developed the following estimated regression equation…
A: The admissions officer for a certain college developed the following estimated regression equation…
Q: The slope was found to be b, = 6.715 and will be used to find the intercept, bo. The formula for the…
A: Given that, b1= 6.715, b0= 16.706 Regression equation=?
Q: For a simple linear regression model, a 100(1 - a)% prediction interval for a new value of Y when X…
A:
Q: The admissions officer for a certain college developed the following estimated regression equation…
A: The multiple regression equation is, ŷ = bo+b1x1+b2x2+.... +bnxn Here bo is the intercept. b1, b2,…
Q: The manufacturer of Beanie Baby dolls used quarterly price data for 2005 / 2013 /V(1-1, 36) and the…
A: Statisticians use the time-series regression analysis to predict future values.
Q: A shoe store developed the following estimated regression equation relating sales to inventory…
A:
Q: c. In a large class, the average grade in an economics course was 80 with SD of 10 points and the…
A: c) It is given that the regression model uses grades in economics to predict grades in psychology.…
Q: Which of the following does NOT indicate a clear violation of the assumptions for linear regression…
A: In linear regression is the linear method to model the relation between dependent variable and one…
Q: Which equation best represents the regression line for the data given in the table above? Oy=-3x+22…
A:
Q: The grades of a sample of 9 students on a prelim exam (x) and on the midterm exam (y) are shown…
A: Calculate Fitting a straight line - Curve fitting using Least square method X Y 96 99 81 47…
Q: The figures for Triple A's revenue and the amount of money earned by wage earners in Albany - NY has…
A: The required table for the given data can be formed as follows Y X (X-X_bar)^2 (Y-Y)(X-X) 6.5…
Q: (A)Determine the regression equation in y = ax + b form and write it below? (B) How many murders…
A: We want to equation of regression line in y = ax + b
Q: set of X and Y scores has SSx=10,Ssy=20,and SP =8,what is the b in the regression equation?
A:
Q: The table below shows the number of state-registered automatic weapons and the murder rate for…
A: Solution: Let x= thousands of automatic weapons and y=murders per 100,000 residents. The given table…
Q: Construct the equation of the regression line. The following table lists the age of a cow (in years)…
A: Find Regression line equations from the following data X Y 4 37 4 35.4 6 33.3 7 33.1 7…
Q: The table below shows the number of state-registered automatic weapons and the murder rate for…
A: Given , x = thousands of automatic weapons y = Murders per 100,000 Given regression equation , y…
Q: Suppose that you have created a linear regression model ŷ = bo + bị x , where Sy = 2.0, b1 =-2.00,…
A: The value of sy is 2.0, b1 is -2.00 and sx is 0.5.
Q: Given the two regression lines x+2y-5 0, 3y + 2x-8=0, the means of x and y are 2,2 O 2.5, 1.5 O 5,4…
A: Given, Two regression lines x+2y-5=0 3y+2x-8=0
Q: Consider the regression equation y, = B, +B,x; +u;, i=1,..,N . %3D Exy, - Nãỹ Ex² - Nx? B = j-Bx.…
A: Using the given data on 10 observations. Taking 2nd column as X and 3rd column as Y.
Q: CO 8. use the given data to find the equation of the regression line. 15 16 11 14 20
A:
Q: The equation used to predict college GPA (range 0-4.0) is y = 0.17 +0.51x, +0.002x,, where x, is…
A:
Q: create a line in DESMOS with the linear regression equation: y1 ~ mx1 + b 2) create a second line…
A: Here the given table is Time 0 20 40 60 80 100 120 140 160 180 200 220 Water level 42.6…
Q: The table below shows the number of state-registered automatic weapons and the murder rate for…
A: x¯=∑xn=37.28=4.65y¯=∑yn=63.98=7.9875
Q: (b) What would the consequence be for a regression model if the errors were not homoscedastic? (c)…
A:
Q: Use the data given to solve the following problems. Savings needed for Health-Care Expenses During…
A: The regression is a method of machine learning under subgroup Supervised Learning. The regression…
Q: 3. Find the regression line y atbx ? y xy
A: Given data,
Q: The table below shows the number of state-registered automatic weapons and the murder rate for…
A: Given: X = thousands of automatic weaponsY = murders per 100,000 residents The equation of linear…
Q: 2 3 4 5 Yi 2 8 10 14 2(x, – *)(y, – ÿ) 2(x, - x)2 (d) Develop the estimated regression equation by…
A: xi yi (xi-x) (xi-x)2 (yi-y) 1 2 -2 4 -6 2 8 -1 1 0 3 6 0 0 -2 4 10 1 1 2 5 14 2 4 6 Mean…
Q: Given are five observations collected in a regression study on two variables. xi 2 6 9 13 20…
A: Solution: b. The regression equation is obtained by using excel. Procedure: Enter the data in…
Q: Find the equation of the regression line for the given data. -3 -6 = -2.097x + 0.206 %3D = 0.206x -…
A:
Q: The table below shows the number of state-registered automatic weapons and the murder rate for…
A: Regression: The regression analysis is conducted here by using EXCEL. The software procedure is…

Step by step
Solved in 2 steps with 2 images

- If a study determines the difference in average salary for subpopulations of mechanical engineers and civil engineers is NOT significant, then the subpopulations of mechanical and civil engineers are ________ different salaries. Guaranteed not to be earning 2.Earning very 3.Definitely earning 4.0Not earningA research team is hired to investigate the prevalence of periodontal disease in a rural countywith a low average socio-economic status. The team is given the task of surveying the area, andproviding a brief examination of participants to correctly identify cases of periodontal diseaseand estimate an overall prevalence. If the team identifies an overall prevalence of above 25%, thesponsoring organization is to initiate an active campaign promoting healthy dental practice. Outof 2,879 participants surveyed, 589 were identified to have periodontal disease. A) Conduct a formal test for detecting if the prevalence of periodontal disease in the sample issignificantly different from the minimum prevalence for intervention. Use an alpha level of 0.01.B) Interpret your conclusions.Some research has shown that older parents are not as strict when disciplining their children compared to younger parents. Children of older parents are more likely to be in daycare and have greater independence than children of younger parents, whereas children of younger parents are more likely to be at home with parents and other siblings, and encounter more home discipline. A researcher observed the disciplinary habits of 456 families with at least one child, categorizing each as "high" or "low" in terms of disciplinary strictness. The families were also divided into older parents (those 29 years of age or younger) and older parents (30 years old and up). Are the following data consistent with the hypothesis that older parents are not as strict when disciplining their children? Calculate gamma and interpret it's direction and magnitude, and summarize your findings in a few sentences. Level of discipline Parental age 29 years or younger 30 years or…
- The accompanying boxplots show the brain size (in hundreds of thousands of pixels) for 20 men and 20 women Estimate the numerical values of the medians by using the boxplots. Do these men, or do these women, have greater variation in brain size? Why? estimate the numerical values of the medians by using the boxplots.A personnel office is gathering data regarding working conditions. Employees are given a list of five conditions that they might want to see improved. They are asked to select the one item that is most critical to them. Which type of graph, circle graph or Pareto chart, would be the most useful for displaying the results of the survey? Why?Lin Chi-Ling works for an insurance company and is studying the relationship between types of crashes and the vehicles involved in passenger vehicle occupant deaths. As part of your study, you randomly select 4270 vehicle crashes and organize the resulting data as shown in the contingency table. At α = 0.05 can you conclude that the type of crash depends on the type of vehicle? Vehicle Type of crash Car Pickup Sport utility Single-vehicle 1237 547 479 Multiple-vehicle 1453 307 247 What is the Chi-square test statistics and the decision for this question. The Test statistics is . Leave answers in 3 decimal places. DECISION: We the null hypothesis.
- Danielle Navarro tells the story of: ... watching an animated documentary examining the quaint customs of the natives of the planet Chapek 9. Apparently, in order to gain access to their capital city a visitor must prove that they’re a robot, not a human. In order to determine whether or not a visitor is human, the natives ask whether the visitor prefers puppies, flowers, or large, properly formatted data files. “Pretty clever,” I thought to myself “but what if humans and robots have the same preferences? That probably wouldn’t be a very good test then, would it?” As it happens, I got my hands on the testing data that the civil authorities of Chapek 9 used to check this. It turns out that what they did was very simple. They found a bunch of robots and a bunch of humans and asked them what they preferred. I saved their data in a file called chapek9.csv .... In total there are 180 entries in the data set, one for each person (counting both robots and humans as “people”) who was asked to…Danielle Navarro tells the story of: ... watching an animated documentary examining the quaint customs of the natives of the planet Chapek 9. Apparently, in order to gain access to their capital city a visitor must prove that they’re a robot, not a human. In order to determine whether or not a visitor is human, the natives ask whether the visitor prefers puppies, flowers, or large, properly formatted data files. “Pretty clever,” I thought to myself “but what if humans and robots have the same preferences? That probably wouldn’t be a very good test then, would it?” As it happens, I got my hands on the testing data that the civil authorities of Chapek 9 used to check this. It turns out that what they did was very simple. They found a bunch of robots and a bunch of humans and asked them what they preferred. I saved their data in a file called chapek9.csv .... In total there are 180 entries in the data set, one for each person (counting both robots and humans as “people”) who was asked to…which option is correct The data mining term of "score" is known as a(n) _______________ in statistical terminology. Multiple Choice forecast record algorithm feature
- If the Cumulative Gain at a depth of 10% for the Decision Tree is converted to number of primary/positive event cases, what will be the number of cases? Show your calculationGeckos are lizards with specialized toe pads that enable them to easily climb all sorts of surfaces. A research team examined the adhesive properties of 7 tokay geckos. Displayed are the toe-pad areas (in square centimeters, cm^2) for this sample. 5.6, 4.9, 6.0, 5.1, 5.5, 5.1, 7.5 which of these ranges must a value fall outside of to be considered an outlier according to the 1.5x IQR rule? A. 5.10 to 6.00 b. 4.20 to 7.35 c. 3.75 to 7.35 d. 4.90 to 7.50A researcher conducted a study to investigate whether local car dealers tend to charge women more than men for the same car model. Using information from the county tax collector’s records, the researcher randomly selected one man and one woman from among everyone who had purchased the same model of an identically equipped car from the same dealer. The process was repeated for a total of 8 randomly selected car models. The purchase prices and the differences (woman – man) are shown in the table below. Summary statistics are also shown. Dotplots of the data and the differences are shown below. Do the data provide convincing evidence that, on average, women pay more than men in the county for the same car model?

