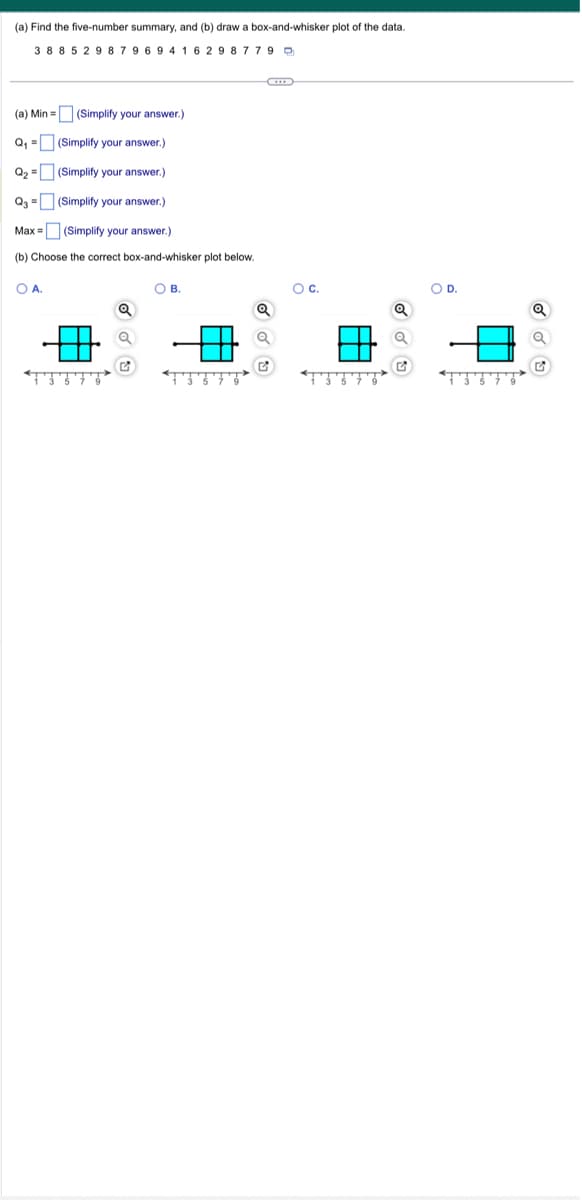
(a) Find the five-number summary, and (b) draw a box-and-whisker plot of the data. 38 85 2987 969416298779 (a) Min = (Simplify your answer.) Q₁ = (Simplify your answer.) Q₂-(Simplify your answer.) Q3 (Simplify your answer.) Max = (Simplify your answer.) (b) Choose the correct box-and-whisker plot below. O A. B. TTT O C. O D. TTT


Q: Determine whether the following statement is true or false. If it is false, rewrite it as a true…
A: The given statement is 'The mean is the measure of central tendency most likely to be affected by an…
Q: In a certain Algebra 2 class of 27 students, 11 of them play basketball and 9 of them play baseball.…
A: Given that Total students = S= 27 Play basketball= A = 11 Play baseball = B = 9 Play neither sport…
Q: What is the test statistic?(round to two decimal places) What is the pvalue?(round to three decimal…
A:
Q: The data in the table are the selling prices z of a certain make and model of used car o years old.…
A: Given that, z^ = cdw ln z^ = ln c + ( ln d )*w Where b0= ln c b1= ln d Let Y = ln z^ Y= b0+b1w…
Q: Arbitron Media Research Incorporated conducted a study of the iPod listening habits of men and…
A: The following information has been provided: n1=9 n2=21x¯1=33…
Q: b. Partition the total sum of squares into the SSR and SSE. SSE= SSR= (Round to two decimal places…
A: The given linear regression equation is Predicted Demand=15.58+1.15Temperature.
Q: What is the class width? What are the approximate lower and upper class limits of the first class?…
A: It is given that the histogram that represents the weights ( in pounds ) of members of a certain…
Q: The 9 members of the swim team completed the following numbers of laps at today's practice:…
A: As per our guidelines we are supposed to answer only one question per post so i am solving first…
Q: eigh a large pumpkin before it is harvested, so = tally and vertically, then adds the results. This…
A: Hi! Thank you for the question, As per the honour code, we are allowed to answer three sub-parts at…
Q: 4. A researcher obtained the following results for an analysis using a suggested new procedure and a…
A: Given: n1 = 4 n2 = 3 Critical value t* = 2.57 Formula Used: Test-statistic t = X1-X2sp1n1+1n2 Where…
Q: Given are five observations for two variables, * and y. Excel File: data14-25.xlsx The estimated…
A: Given information:
Q: Which one of the following histograms could represent a distribution of salaries paid at a financial…
A:
Q: A bag contains 9 Blue balls, 5 Red balls, and 7 Green balls. Two balls are going to be drawn from…
A:
Q: The following table shows the cumulative frequency distribution of the preferred length of kitchen…
A: Given data is : Length (in meters) more than 1.0 1.5 2.0 2.5 3.0 3.5Housewives…
Q: X is the Binomial Random Variable which counts the number of students who passed an exam. If the…
A:
Q: a) 99.7% of the widget weights lie between and b) What percentage of the widget weights lie between…
A: It is given that Mean, μ = 37 Standard deviation, σ = 6
Q: Assume that a local garment manufacturer has 2,700 employees. manager then decides to obtain the…
A: Employees in a Local garment manufacturing Unit - 2700 The manager chooses a sample of 300…
Q: 1 out of 500 randomly selected fish from Lake One are poisoned, while 28 out of 600 randomly…
A: We have to find confidence interval for difference in proportion. Formula : CI…
Q: A Statistics professor wants to determine how students’ final grades are related to the midterm exam…
A: Given data: Final Grade (y) Midterm Grade (x1) Classes Missed (x2) 81 75 1 90 80 0 86 91 2…
Q: Where did 1.463 and +- 1.960 came from
A: here 1.463 is Z-value and ±1.960 is Critical value from given data we have:…
Q: What is the test statistic?(round to two decimal places) What is the pvalue?(round to three decimal…
A: Given: Demand Price 17 350 19 360 14 370 11 380 9 390 Sample correlation…
Q: Scores for a common standardized college aptitude test are normally distributed with a mean of 510…
A: As bartleby guideline one ques. Solve only
Q: Find the mean of the data summarized in the given frequency distribution. Compare the computed mean…
A: Given data: Speed (miles per hour) Frequency 42-45 21 46-49 15 50-53 7 54-57 3 58-61 1…
Q: a) Draw a scatter diagram for the above data and interpret the relationship between the two…
A: Followings are the Explanation of the Question a) Use the Excel and draw the Scatterplot Followings…
Q: Crespectively. The media offen present reports about the dangers of cell phone radiation as a cause…
A: Arrange the data set in ascending order are. 0.21, 0.35, 0.44, 0.48, 0.57, 0.85, 1.03, 1.25, 1.26,…
Q: Suppose it is known that in a certain community 30% of the households have a micro-wave oven. If we…
A: Givenp=0.30sample size(n)=19Let "x" no.of households will have micro-wave…
Q: point(s) possible For the statement below, write the claim as a mathematical statement. State the…
A:
Q: alap A company wishes to purchase one of five different machines A, B, C, D, E. In an experiment…
A: In the given situation, Null Hypothesis: H0: There is no difference in the performance of the five…
Q: An economist desired to estimate a line relate to personal disposable income (DI) to consumption…
A: Given: Sample size, n is 9 DI CE 25 21 22 20 19 17 36 28 40 34 47 41 28 25 52 25…
Q: struct a 95% confidence interval of the population proportion using the given x= 175, n = 250 Click…
A:
Q: The local pilots association examined records from this year's census of its members. Miguel is a…
A: Given that Mean = 3260 Standard deviation = 865 X = 3375
Q: 20. Calculate average 10, 13, 15, 20 21. Calculate average 30, 40, 41, 48, 59, 62 22. Calculate…
A: 20)Given data set is 10,13,15,20
Q: Management rate employees according to job performance (y) and attitude (x). The results for several…
A: The question is about testing of correlation Given : Level of signif. ( α ) = 0.05 To test :…
Q: A study was done to look at the relationship between number of vacation days employees take each…
A: “Since you have posted a question with multiple sub-parts, we will solve first three subparts for…
Q: nned with an allocated budget of $50,000 per month for advertising and planned average price of…
A: outlet_no qty_sold avg_price advert_exp 1 85300 10.14 64800 2 40500 10.88 42800 3 61800 12.33…
Q: A manufacturer has to take a decision on what length of slabs to manufacture. What length would you…
A: First we have to find the frequency distribution : so, Length between 1.0 and 1.5 = 50-48 = 2…
Q: fitness company is building a 20-story high-rise. Architects building the high-rise know that women…
A: Given 1) Mean=178 Standard deviations=29 Sample size=18 2) Mean=0.956 Standard deviations=0.302…
Q: If the test statistic is 1.95 on the Z distribution at a 3% significance level for a right-sided…
A: According to the given information in this question We need to write the conclusion for the given…
Q: normally distributed length, with a mean of 14.9 inches, and standard deviation of 3.1 inches. If…
A: Given 1) Mean=14.9 Standard deviations=3.1 n=13 2) Mean=178 Standard deviations=29 n=18
Q: What is the relationship between the amount of time statistics students study per week and their…
A: Since you have posted a question with multiple sub-parts, we will solve the first 3 sub-parts for…
Q: Suppose that an e-business on the Internet receives an average of 5 orders per hour. Assume that the…
A: GivenAn average of 5 orders per hourλ=5 orders per hourLet "x" be the no.of orders…
Q: The local pilots association examined records from this year's census of its members. Miguel is a…
A: Given,mean(μ)=3260standard deviation(σ)=865Miguel's flight experiance(X)=3375
Q: A machine is set to fill containers up to 12 oz. The machine is considered to be in perfect…
A: The following information has been provided: n=210x¯=12.04s=0.32μ=12
Q: Give the five-number summary and the interquartile range for the data set. Five-number summary…
A: It is given that the ages of 13 mathematics teachers in a school district are: 28, 29, 31, 31, 34,…
Q: 6. Here are some exam scores (there were 9 exams) from my three best Stats students at Napa High…
A:
Q: Your medical research team is investigating the mean cost of a 30-day supply of a certain heart…
A: Hypothesis Testing: A method of statistical study entitled hypothesis testing involves testing your…
Q: Use technology to help you test the claim about the population mean, μ, at the given level of…
A: The following information has been provided: x¯=1198.51n=250σ=207.79
Q: In order to estimate the difference between the average miles per gallon of two different models of…
A:
Q: Determine the following: ● Mean ● Median Mode • Standard deviation Variance ● Class interval 30-34…
A: Given data is Class Interval Frequency 30 - 34 3 35 - 39 6 40 - 44 7 45 - 49 12 50 - 54…
Q: Your medical research team is investigating the standard deviation of the cost of a 30-day supply of…
A:

Step by step
Solved in 4 steps with 1 images

- Sports The ordered pairs below give the winning times (in seconds) of the women’s 100-meter freestyle in the Olympics from 1984 through 2012. 1984,55.92 2000,53.83 1988,54.93 2004,53.84 1992,54.64 2008,53.12 1996,54.50 2012,53.00 (a) Sketch a scatter plot of the data. Let y represent the winning time (in seconds) and let t=84 represent 1984. (b) Sketch the line that you think best approximates the data and find an equation of the line. (c) Use the regression feature of a graphing utility to find the equation of the least squares regression line that fits the data. (d) Compare the linear model you found in part (b) with the linear model you found in part (c).4A Create a scatterplot of the data. Height is X-axis and Shoe size is Y-axis Person 1 Person 2 Person 3 Person 4 Person 5 Person 6 Person 7 Person 8 Person 9 Height (inches) 69 67 67 64 68 69 58 74 70 Shoe Size 10 9.5 10 9 9.5 11 6 11.5 10.51. A researcher is interested in knowing if there is a relationship between the size of the television (inches) and the price at the local Walmart’s. Inches Price (dollars) 9 147.00 20 197.00 27 297.00 31 447.00 35 1177.00 40 2177.00 60 2497.00 Using the data in the above table, provide the following information: a.What are your conclusions and observations about the relationship between the two variables? b. What is the value of the intercept a? c.What is the value of the slope b? d. Write the linear regression equation
- #7. Health Care: Nurses At Center Hospital there is some concern about the high turnover of nurses. A survey was done to determine how long (in months) nurses had been in their current positions. The responses (in months) of 20 nurses were 23 2 5 14 25 36 27 42 12 8 7 23 29 26 28 11 20 31 8 36 Make a box-and-whisker plot. Find the interquartile range.Measles and Mumps A researcher wishes to see if there is a relationship between the number of reported cases of measles and mumps for a recent 5 -year period. Is there a linear relationship between the two variables? Measles Cases 47 139 66 56 207 Mumps Cases 797 438 2005 2611 375 (a) Draw the scatter plot for the variables. Measles and Mumps Mumps y 500 1000 1500 2000 2500 3000 x 50 100 150 200 250 0 (b) Compute the value of the correlation coefficient. Round your answer to at least three decimal places. =r (c) State the hypotheses. H0 : H1 : (d) Test the significance of the correlation coefficient at =α0.05 , using The Critical Values for the PPMC Table. Critical values: ± ▼(Choose one) the null hypothesis.…Hello, Consider, a researcher wants to identify the relationship between the height and weight of 10 students. The considered data set is: Height(Inches) (X) Weight(Pounds) (Y) 65.78 112.99 71.52 136.49 69.4 153.03 68.22 142.34 67.79 144.3 68.7 123.3 69.8 141.49 70.01 136.46 67.9 112.37 66.78 120.67 Construct the scatter plot of the data and the regression line.
- The following table shows retail sales in drug stores in billions of dollars in the U.S. for years since 1995. Year Retail Sales 0 85.851 3 108.426 6 141.781 9 169.256 12 202.297 15 222.266 Let y be the retails sales in billions of dollars in xx years since 1995. A linear model for the data is y=9.44x+84.182y=9.44x+84.182.A) Use the above scatter plot to decide whether the line of best fit, fits the data well. a) The function is a good model for the data. or b) The function is not a good model for the data B) To the nearest billion, estimate the retails sales in the U. S. in 2011. __?__ billions of dollars.C) Use the equation to find the year in which retails sales will be $234 billion. __?__The percentage of employees who cease their employment during a year is referred to as employee turnover, and it is a serious issue for businesses. The following table shows the cost, in millions of dollars, to a certain company for a given employee turnover percentage in a year. E = employee turnover 10 20 30 40 C = cost 250 390 530 670 Find a linear model for the data. C(E) =A. Interpret the slope associated with mother's height and the intercept of this model. B. Calculate the test statistic that is labeled "C" in the output. C.What are the null and alternative hypotheses corresponding to the test statistic labeled "C" and its corresponding p-value in the output. H0: r = 0 HA: r ≠ 0 H0: b = 0 HA: b ≠ 0 H0: ρ = 0 HA: ρ ≠ 0 H0: β = 0 HA: β ≠ 0 D. What is the predicted height for a child born to a mother with a height of 67 inches and a father with a height of 71 inches? intercept of this model.
- A study on driving speed (miles per hour) and fuel efficiency (miles per gallon) for midsize automobiles resulted in the following data. Driving Speed 30 40 60 55 25 30 50 55 25 50 Fuel Efficiency 32 27 21 25 34 30 28 27 37 25 (a) Construct a scatter diagram with driving speed on the horizontal axis and fuel efficiency on the vertical axis. A scatter diagram has 10 points. The horizontal axis is labeled: Driving Speed (MPH), and ranges from 0 to 70. The vertical axis is labeled: Fuel Efficiency (MPG), and ranges from 0 to 40. The graph starts at the points (25, 25) and (25, 26) and moves to the right toward the point (60, 28). The points are all plotted close together and stay between the vertical values of 24 and 29 inclusive. A scatter diagram has 10 points. The horizontal axis is labeled: Driving Speed (MPH), and ranges from 0 to 70. The vertical axis is labeled: Fuel Efficiency (MPG), and ranges from 0 to 40. Most of the points follow a trend that starts at (25,…The following table shows retail sales in drug stores in billions of dollars in the U.S. for years since 1995. Year Retail Sales 0 85.851 3 108.426 6 141.781 9 169.256 12 202.297 15 222.266 Let � be the retails sales in billions of dollars in � years since 1995. A linear model for the data is �=9.44�+84.182.36912158090100110120130140150160170180190200210220A) Use the above scatter plot to decide whether the line of best fit, fits the data well. The function is a good model for the data. The function is not a good model for the data B) To the nearest billion, estimate the retails sales in the U. S. in 2017. billions of dollars.C) Use the equation to find the year in which retails sales will be $231 billion.A sales manager for an advertising agency believes that there is a relationship between the number of contacts that a salesperson makes and the amount of sales dollars earned. A regression analysis shows the following results. Coefficients Standard Error t-Stat p-value Intercept −12.201 6.560 −1.860 0.100 Number of contacts 2.195 0.176 12.505 0.000 What is the Y-intercept of the linear equation? Multiple Choice −12.201 2.195 −1.860 12.505

