(a) Find the percentile for Jackson, who reported owning 22 pairs of shoes. (b) Raul's reported number of pairs of shoes is at the 45th percentile of the distribution. Interpret this value. How many pairs of shoes does Raul own?
(a) Find the percentile for Jackson, who reported owning 22 pairs of shoes. (b) Raul's reported number of pairs of shoes is at the 45th percentile of the distribution. Interpret this value. How many pairs of shoes does Raul own?

Glencoe Algebra 1, Student Edition, 9780079039897, 0079039898, 2018
18th Edition
ISBN:9780079039897
Author:Carter
Publisher:Carter
Chapter10: Statistics
Section10.5: Comparing Sets Of Data
Problem 26PFA

Related questions
Question
please help and answer all parts asap! thanks.
Transcribed Image Text:104
MODELING DISTRIBUTION
CHAPTER 2
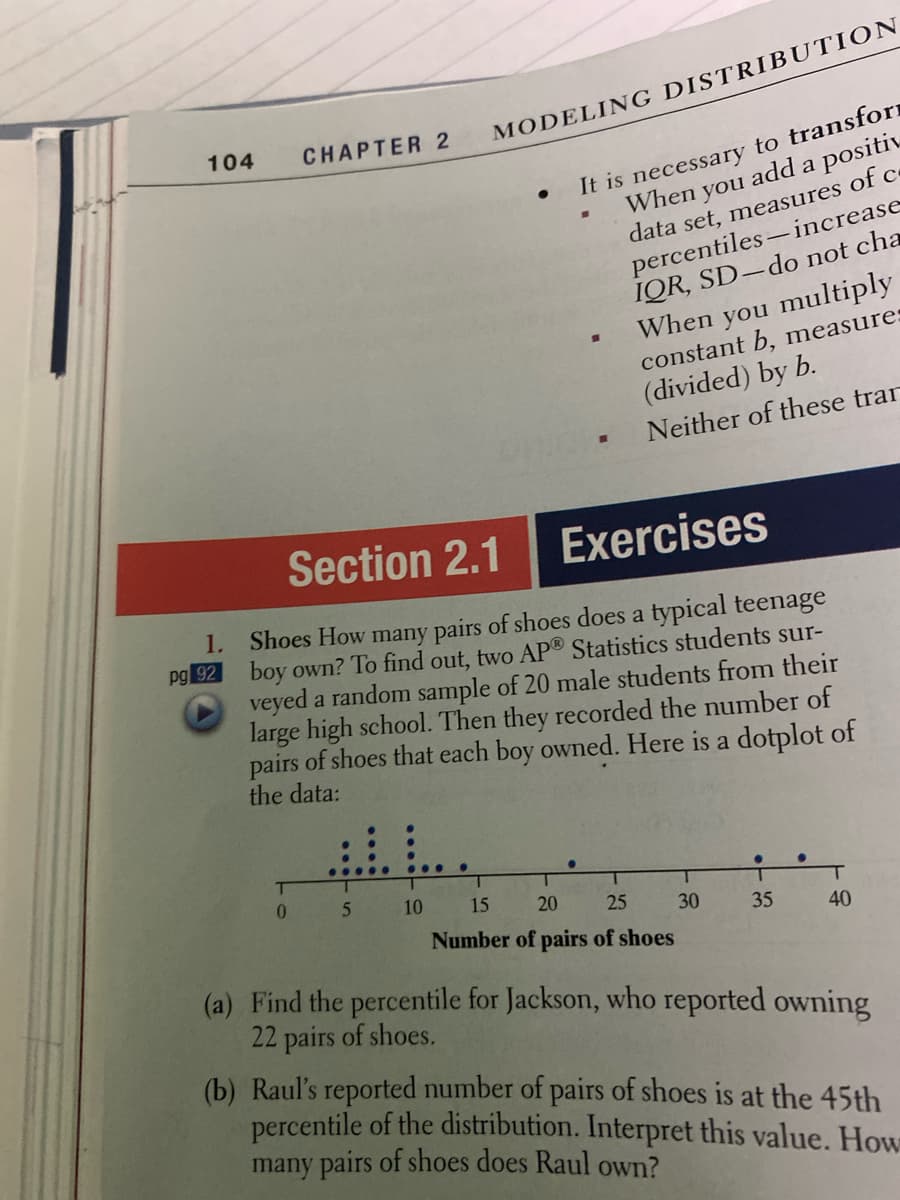
It is necessary to transforn
When you add a positiv
data set, measures of c
percentiles-increase
IQR, SD-do not cha
When you multiply
constant b, measure:
(divided) by b.
Neither of these trar
Section 2.1
Exercises
1.
Shoes How many pairs of shoes does a typical teenage
boy own? To find out, two AP® Statistics students sur-
veyed a random sample of 20 male students from their
large high school. Then they recorded the number of
pairs of shoes that each boy owned. Here is a dotplot of
the data:
pg 92
...
0.
1.
10
15
20
25
30
35
Number of pairs of shoes
40
(a) Find the percentile for Jackson, who reported owning
22 pairs of shoes.
(b) Raul's reported number of pairs of shoes is at the 45th
percentile of the distribution. Interpret this value. How
many pairs of shoes does Raul own?
Expert Solution
This question has been solved!
Explore an expertly crafted, step-by-step solution for a thorough understanding of key concepts.

This is a popular solution!

Trending now
This is a popular solution!

Step by step
Solved in 2 steps with 2 images

Recommended textbooks for you
Glencoe Algebra 1, Student Edition, 9780079039897…
Algebra
ISBN:
9780079039897
Author:
Carter
Publisher:
McGraw Hill

Functions and Change: A Modeling Approach to Coll…
Algebra
ISBN:
9781337111348
Author:
Bruce Crauder, Benny Evans, Alan Noell
Publisher:
Cengage Learning

Holt Mcdougal Larson Pre-algebra: Student Edition…
Algebra
ISBN:
9780547587776
Author:
HOLT MCDOUGAL
Publisher:
HOLT MCDOUGAL
Glencoe Algebra 1, Student Edition, 9780079039897…
Algebra
ISBN:
9780079039897
Author:
Carter
Publisher:
McGraw Hill
Functions and Change: A Modeling Approach to Coll…
Algebra
ISBN:
9781337111348
Author:
Bruce Crauder, Benny Evans, Alan Noell
Publisher:
Cengage Learning
Holt Mcdougal Larson Pre-algebra: Student Edition…
Algebra
ISBN:
9780547587776
Author:
HOLT MCDOUGAL
Publisher:
HOLT MCDOUGAL

Algebra: Structure And Method, Book 1
Algebra
ISBN:
9780395977224
Author:
Richard G. Brown, Mary P. Dolciani, Robert H. Sorgenfrey, William L. Cole
Publisher:
McDougal Littell