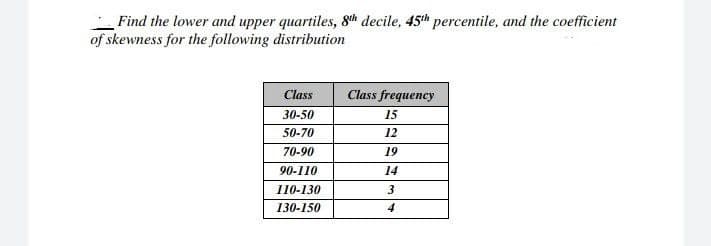
Find the lower and upper quartiles, 8h decile, 45th percentile, and the coefficient of skewness for the following distribution Class Class frequency 30-50 15 50-70 12 70-90 19 90-110 14 110-130 3. 130-150 4
Q: Find the upper quartile of the data shown on the box-and-whisker plot below. 10 20 30 40 50 60 70 80…
A:
Q: Calculate the 1st quartile, 7th decile, 35th percentile, and percentile rank of 115 and 155 for the…
A: Given data: Class Interval Frequency 71-80 4 81-90 9 91-100 13 101-110 11 111-120 7…
Q: 4. Find mean value of the given data. Scores Frequency (f) 41-45 36-40 8 31-35 26-30 14 21-25 16-20
A: Score and frequency are the given information, We have to form a table , Score Frequency (fi)…
Q: Find the mean, median, and mode for the frequency distribution of score of 56 students in Statistics…
A:
Q: Given the following frequency distribution of number of vacationers per age bracket of vacationers…
A: Given: cumulative frequency (cf): Add previous frequencies to corresponding frequency . Class:…
Q: O c. They are an attempt to represent the underlying population distribution
A: Statistical populations tend to trace the empirical distribution: statistical distribution -…
Q: Represent the following distribution by a (î) histogram and (i) frequency polygon. Scores Frequency…
A:
Q: Use the Empirical Rule to find the 95% range and find the percentage of data points in that range.…
A: Given data is5,6,3,3,4,2,7,8,9,2,5,4,3,11,21,31,22,27,28,18
Q: find the percentile for the data value. Data set: 4 13 8 6 4 4 13 6 4 13 2 13 15 5 9 4 12 8 6 13;…
A: Given data, 4 ,13 ,8 ,6 ,4, 4, 13, 6, 4, 13, 2, 13, 15, 5, 9, 4, 12, 8, 6, 13 Sort given data in…
Q: Determine the distribution of the data pictured below 4 i 2 3 4 5 6 7 8 data O Uniform O Bell-shaped…
A: Determine the distribution from given histogram
Q: The following data represents the age distribution of a sample of 100 people covered by Health…
A: Note: Hey there! Thank you for the question. As you have posted a question with multiple sub-parts,…
Q: Calculate the mean of the data set represent via the distribution below. Class Midpoints Frequency 9…
A: Let us denote, x f 9 11 14 8 19 10 24 5 29 6 34 9 Mean: x f x*f 9 11 99…
Q: The number of patients coming into a hospital's emergency clinic between midnight and 6:00 AM was…
A: Introduction: The median method for finding quartiles first find the median of the entire data set,…
Q: Use the following cell phone airport data speeds (Mbps) from a particular network. Find the…
A: Given information- We have given the cell phone airport data speeds (Mbps) from a particular…
Q: Find the 1st quartile, 7th decile, 35th percentile, and percentile rank of 115 and 155 for the…
A:
Q: Consider the following data values. 5 13 17 2 15 5 17 18 a) Calculate the mean. b) Calculate the…
A: to find mean valuemean = sum of observations/ count of observationsmean = (5 + 13 + 17 + 2 + 15 + 5…
Q: 15c) Find the mode for the scores in the following frequency distribution table: Cumulative Number…
A:
Q: Construct a frequency distribution table for the fol- lowing set of scores. Include columns for…
A: Introduction: The frequency distribution for the given scores is to be constructed.
Q: II. PERFORMANCE TASK Find the percentile rank of 115 and 155 for the following distribution Class…
A:
Q: The speeds of a random sample of 100 cars are recorded as they pass a highway checkpoint. The…
A: There is gap between the classes. So we need to change the classesso that the classes will be…
Q: For the frequency distribution shown, compute : mean , median , mode , mean deviation , sample…
A:
Q: 3. Find the 42nd and 87th percentile for following data that shows the number of worms found under…
A:
Q: Score 36 35 34 33 32 31 30 29 28 1 Frequency 2 4 3 5 4 3 3 4
A: We know that Mean = sum of all observations/total number of observations Median = middle value…
Q: For the data below construct the frequency distribution table with 5 classes and after that find: 1)…
A: Given data is appropriate for measures of central tendency to find the central value for the given…
Q: The scores from 50 psychology students that took a standardized test are summarized in the given…
A:
Q: 2. Use medians to find the quartiles of a data set. The table below list the calories per 100…
A: Quartiles divide the data into 4 equal parts. First quartile is equivalent to 25th percentile.…
Q: Find the upper and lower quartiles of the following data Classes 150-196 200-246 250-296 300-344…
A:
Q: Find the mean, median, and mode of the data. Heights of Students in Class |||| || ||T 60 62 64 66 68…
A: From the given dot plot, the data values are 60, 64, 65, 65, 66, 67, 67, 67, 69, 69, 70, 72, 72, 74,…
Q: Find the quartile deviation, percentile deviation and their coefficients from the following data :…
A:
Q: During a winter flu epidemic, waiting times at a student health center were longer than usual. The…
A:
Q: Q9 For the distribution table below, calculate the second quartile * Class Frequency 50-69 3 70-89 7…
A:
Q: 14. The 45th percentile is Refer to the set of data below: Score Frequency Cumulative Frequency 26 -…
A:
Q: II. Find the mean, the median, and all modes for the data in the given frequency distribution.…
A: The AM of a series is obtained by adding the values of the series and dividing by the number of…
Q: Find the mode for the scores in the following frequency distribution table: Number Frequency…
A: Note: Considering scores as 16, 15, 13, 12, 11 and the corresponding cumulative frequencies are…
Q: When the mean, median and mode are of the same value the distribution should appear symmetric 50 40…
A:
Q: Identify the histogram for the frequency distribution below. Data Frequency 2-6 3 7-11 12-16 6 17-21…
A: Draw Histogram Class Frequency 2 - 6 3 7 - 11 5 12 - 16 6 17 - 21 5 22 - 26 2
Q: Find the mean, median and all modes for the data in the given frequency distribution. Age 7…
A: We use a grouped frequency data: We do the calculations using Excel.
Q: The scores from 50 psychology students that took a standardized test are summarized in the given…
A:
Q: Find the 1ª quartile, 7th decile and 35th percentile of the following distribution. Class Interval…
A: The following information has been given: Class Interval Frequency 151 - 160 8 141 - 150 12…
Q: The raw data displayed below are the observations on the number of passengers who hPve chosen to fly…
A:
Q: 1. Calculate and write the given facts for the identified percentiles class. <cf Ages 73-82…
A: Solution-: We have following table: Age Freq (F) 13-22 1 23-32 6 33-42 6 43-52 6 53-62…
Q: 9. Find Lower quartile, Median, Upper quartile, 6th percentile, 4th quartile from the decile, 95th…
A:
Q: A factory owner has taken a sample (n = 20) of workers to see how many broken widgets each employee…
A: The sample includes total of n=20 observations.
Q: Find the percentile for the data value. Data set: 4 13 8 6 4 4 13 6 4 13 2 13 15 5 9 4 12 8 6 1 Data…
A: Given data, 4,13,8,6,4,4,13,6,4,13,2,13,15,5,9,4,12,8,6,13 What is percentile for data value 6?
Q: For the data below construct the frequency distribution table with 5 classes and after that find:…
A: For the given data , following frequency distribution table is constructed :…
Q: You take a sample of 50 police officers from large urban police departments in Maryland. The table…
A: Measure of central tendency are used to measure the location and average of the data set. These…
Q: b. Use the data to plot an ogive, estimate the median and the quartiles. Weight Kg 30-40 40-50 50-60…
A: Here, Interval Frequency Cumulative Frequency 30-40 4 4 40-50 10 14 50-60 15 29 60-70 12…
Q: Find the 55 th percentile for the data shown using the interpolation method (Definition 3) 1.6 2.3…
A:
Q: The speeds of a random sample of 100 cars are recorded as they pass a highway checkpoint. The…
A:
Step by step
Solved in 4 steps