A firm experienced the demand shown in the following table. Fill in the table by preparing forecasts based on a five-year moving average, a three-year moving average, and exponential smoothing (w = 0.9 and w = 0.3). (Note: The exponential smoothing forecasts may be begun by assuming Ŷt + 1 = Yt.) Year Actual Demand 2000 2001 2002 2003 2004 2005 2006 2007 2008 2009 2010 900 885 875 870 870 875 885 900 920 945 Year 2005 2006 2007 2008 2009 RMSE The following table shows the square errors, Moving Average (5-year) "HHHH" (5-year) 25 100 625 1,600 3,025 Moving Average Fill the table by calculating the root mean square error (RMSE) for each of the methods. Square Error (3-year) 9 169 529 1,089 1,849 (3-year) MMMHH (Y−Y...), for forecasts from 2005 through 2009. O Five-year moving average O Three-year moving average O Exponential smoothi (w = 0.3) O Exponential smoothing (w = 0.9) Exponential Smoothing (W = 0.9) (W = 0.3) Exponential Smoothing (W = 0.9) (W = 0.3) 25 25 100 36 256 361 484 1,089 2,304 729 Based on the RMSE criterion, which of the forecasting methods is the most accurate?
A firm experienced the demand shown in the following table. Fill in the table by preparing forecasts based on a five-year moving average, a three-year moving average, and exponential smoothing (w = 0.9 and w = 0.3). (Note: The exponential smoothing forecasts may be begun by assuming Ŷt + 1 = Yt.) Year Actual Demand 2000 2001 2002 2003 2004 2005 2006 2007 2008 2009 2010 900 885 875 870 870 875 885 900 920 945 Year 2005 2006 2007 2008 2009 RMSE The following table shows the square errors, Moving Average (5-year) "HHHH" (5-year) 25 100 625 1,600 3,025 Moving Average Fill the table by calculating the root mean square error (RMSE) for each of the methods. Square Error (3-year) 9 169 529 1,089 1,849 (3-year) MMMHH (Y−Y...), for forecasts from 2005 through 2009. O Five-year moving average O Three-year moving average O Exponential smoothi (w = 0.3) O Exponential smoothing (w = 0.9) Exponential Smoothing (W = 0.9) (W = 0.3) Exponential Smoothing (W = 0.9) (W = 0.3) 25 25 100 36 256 361 484 1,089 2,304 729 Based on the RMSE criterion, which of the forecasting methods is the most accurate?

Chapter6: Exponential And Logarithmic Functions
Section6.8: Fitting Exponential Models To Data
Problem 3TI: Table 6 shows the population, in thousands, of harbor seals in the Wadden Sea over the years 1997 to...

Related questions
Question
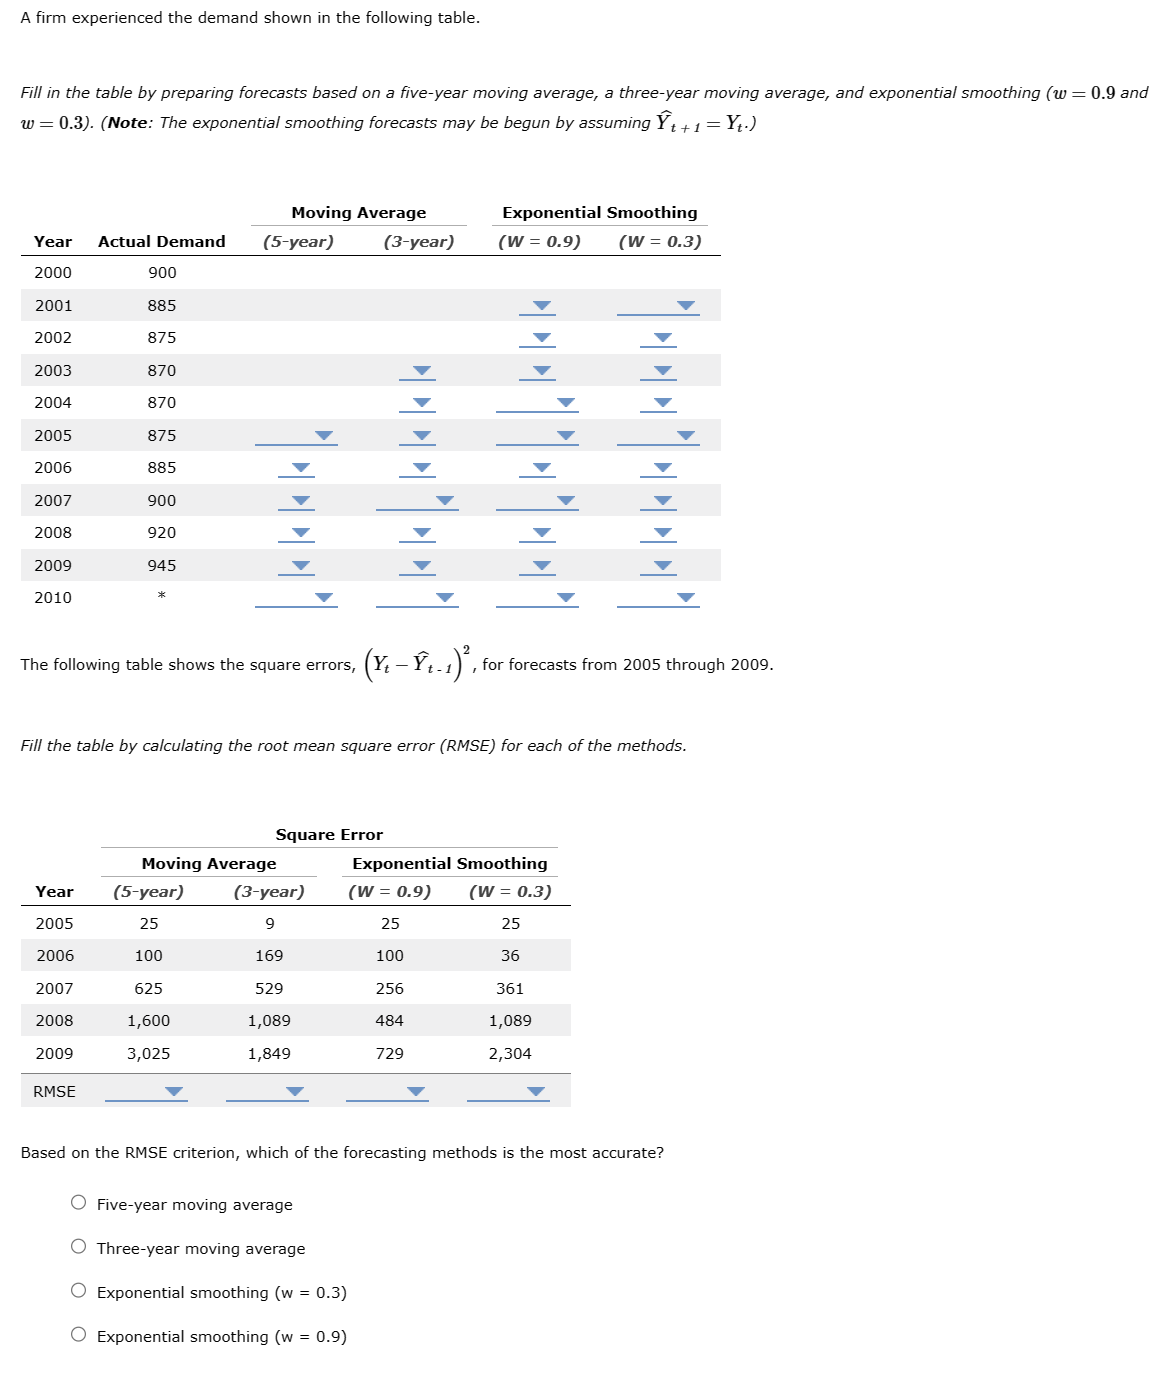
Transcribed Image Text:A firm experienced the demand shown in the following table.
Fill in the table by preparing forecasts based on a five-year moving average, a three-year moving average, and exponential smoothing (w = 0.9 and
w = 0.3). (Note: The exponential smoothing forecasts may be begun by assuming Ŷt + 1 = Yt.)
Year Actual Demand
2000
2001
2002
2003
2004
2005
2006
2007
2008
2009
2010
900
885
875
870
870
875
885
900
920
945
Year
2005
2006
2007
2008
2009
RMSE
The following table shows the square errors,
Moving Average
(5-year)
******
(5-year)
25
100
625
1,600
3,025
Moving Average
Square Error
Fill the table by calculating the root mean square error (RMSE) for each of the methods.
(3-year)
9
169
529
1,089
1,849
(3-year)
*******
(Y-Ý..),
O Five-year moving average
O Three-year moving average
O Exponential smoothing (w = 0.3)
O Exponential smoothing (w = 0.9)
Exponential Smoothing
(W = 0.3)
(W = 0.9)
Exponential Smoothing
(W = 0.9) (W = 0.3)
25
25
100
36
256
361
484
1,089
2,304
729
******
, for forecasts from 2005 through 2009.
Based on the RMSE criterion, which of the forecasting methods is the most accurate?
Expert Solution
Step 1
Given information:
The year and the actual demand for that year are given.

Trending now
This is a popular solution!

Step by step
Solved in 3 steps

Recommended textbooks for you

Algebra & Trigonometry with Analytic Geometry
Algebra
ISBN:
9781133382119
Author:
Swokowski
Publisher:
Cengage

Trigonometry (MindTap Course List)
Trigonometry
ISBN:
9781337278461
Author:
Ron Larson
Publisher:
Cengage Learning
Algebra & Trigonometry with Analytic Geometry
Algebra
ISBN:
9781133382119
Author:
Swokowski
Publisher:
Cengage
Trigonometry (MindTap Course List)
Trigonometry
ISBN:
9781337278461
Author:
Ron Larson
Publisher:
Cengage Learning
