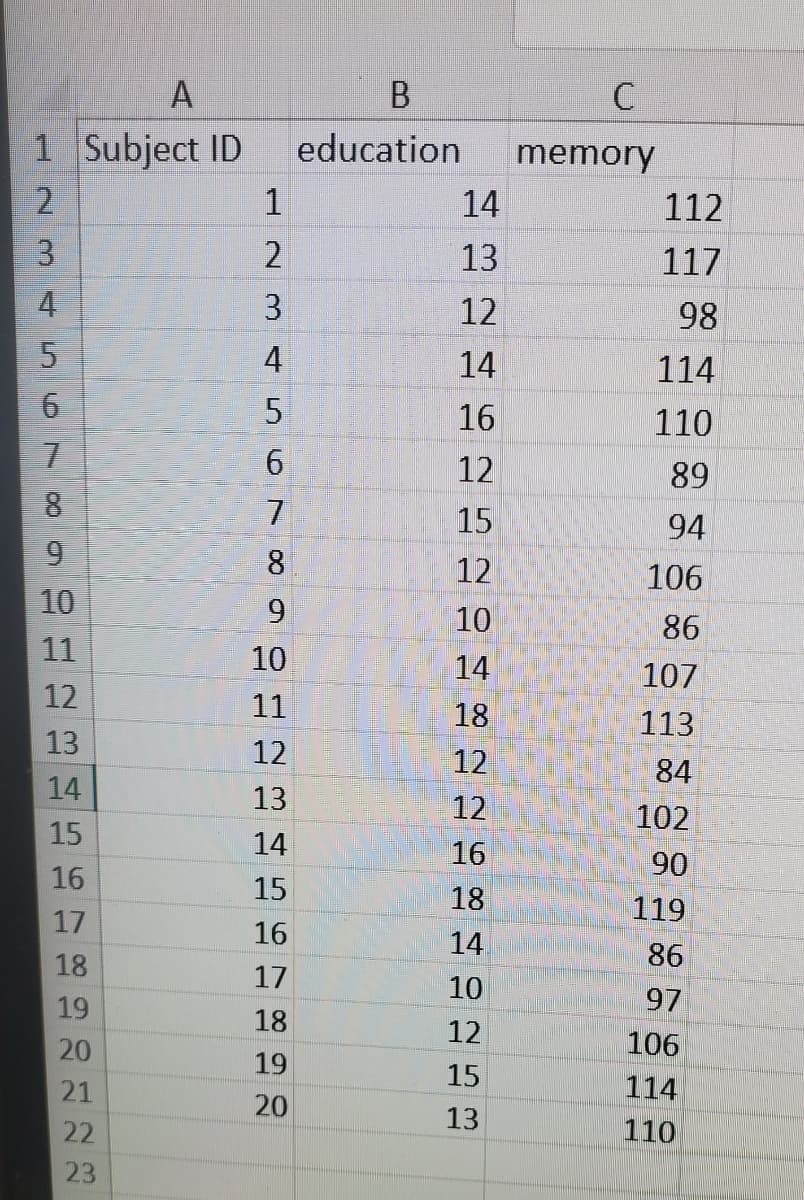
What is the proportion of variance shared between the 2 variables? (How much of the variance in one variable can be predicted by the variance in the other variable?) Provided : mean 1 = 13.6 SD 1 = 2.26 Mean 2 = 102.7, SD= 11.36 Coefficient r = 0.47
What is the proportion of variance shared between the 2 variables? (How much of the variance in one variable can be predicted by the variance in the other variable?) Provided : mean 1 = 13.6 SD 1 = 2.26 Mean 2 = 102.7, SD= 11.36 Coefficient r = 0.47
Algebra: Structure And Method, Book 1
(REV)00th Edition
ISBN:9780395977224
Author:Richard G. Brown, Mary P. Dolciani, Robert H. Sorgenfrey, William L. Cole
Publisher:Richard G. Brown, Mary P. Dolciani, Robert H. Sorgenfrey, William L. Cole
Chapter2: Working With Real Numbers
Section: Chapter Questions
Problem 11MS
Related questions
Question
What is the proportion of variance shared between the 2 variables?
(How much of the variance in one variable can be predicted by the variance in the other variable?)
Provided : mean 1 = 13.6
SD 1 = 2.26
Mean 2 = 102.7, SD= 11.36
Coefficient r = 0.47

Transcribed Image Text:1
2
3
4
A
Subject ID
5
6
7
8
9
10
11
12
13
14
15
16
17
18
19
20
21
DO
22
23
1
2
3
4
5
LO
6
7
00
8
9
10
11
12
13
14
15
16
17
18
19
20
B
education
14
13
12
14
16
12
15
12
10
14
18
12
12
16
18
14
10
12
15
13
C
memory
112
117
98
114
110
89
94
106
86
107
113
84
102
90
119
86
97
106
114
110

Transcribed Image Text:(Round calculated results to the hundredth (2nd place to the right of the decimal) when result extends
beyond that unless otherwise noted).
The data set for this question set (Tab Q1 in the Excel data file) comes from a research project that
tracks the elderly residents in a community to monitor their cognitive function and general health.
Based on the literature, education is considered a protective factor against dementia, and memory
decline is usually the first sign of dementia. So, the researchers would like to know whether education
level (measured in number of years of formal schooling) is correlated with memory function (a
standardized memory test score) in their sample of elderly residents.
Q1a. Create a scatter plot between the two variabloc ucin
Expert Solution
Step 1
Given
The data is as follows:
Mean 1 = 13.6
SD 1 = 2.26
Mean 2 = 102.7,SD= 11.36 Coefficient r = 0.47
Step by step
Solved in 2 steps

Recommended textbooks for you

Algebra: Structure And Method, Book 1
Algebra
ISBN:
9780395977224
Author:
Richard G. Brown, Mary P. Dolciani, Robert H. Sorgenfrey, William L. Cole
Publisher:
McDougal Littell

Algebra & Trigonometry with Analytic Geometry
Algebra
ISBN:
9781133382119
Author:
Swokowski
Publisher:
Cengage

Trigonometry (MindTap Course List)
Trigonometry
ISBN:
9781305652224
Author:
Charles P. McKeague, Mark D. Turner
Publisher:
Cengage Learning

Algebra: Structure And Method, Book 1
Algebra
ISBN:
9780395977224
Author:
Richard G. Brown, Mary P. Dolciani, Robert H. Sorgenfrey, William L. Cole
Publisher:
McDougal Littell

Algebra & Trigonometry with Analytic Geometry
Algebra
ISBN:
9781133382119
Author:
Swokowski
Publisher:
Cengage

Trigonometry (MindTap Course List)
Trigonometry
ISBN:
9781305652224
Author:
Charles P. McKeague, Mark D. Turner
Publisher:
Cengage Learning

Holt Mcdougal Larson Pre-algebra: Student Edition…
Algebra
ISBN:
9780547587776
Author:
HOLT MCDOUGAL
Publisher:
HOLT MCDOUGAL

Elementary Algebra
Algebra
ISBN:
9780998625713
Author:
Lynn Marecek, MaryAnne Anthony-Smith
Publisher:
OpenStax - Rice University