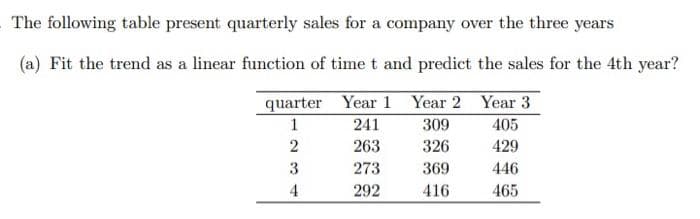
(a) Fit the trend as a linear function of time t and predict the sales for the 4th year? Year 1 Year 2 Year 3 241 309 405 263 326 429 quarter 1


Q: Using Holt's method forecasting with alpha=0.4 and beta=0.5, company ABC would like to forecast the…
A: Holt's method of forecasting involves two smoothing equations. The smoothing equation of level for…
Q: 2. (Use Slovin's Formula) A researcher would like to survey 3,000 college students for his/her…
A: Given that N=3000 99% precise Then we have to find number of students to be considered:
Q: ne r to Choose the correct histogram below. OA. 10- 0- ABCDEFG OC. 10- ABCDEFG O B. 10- 0- ABCDEFG…
A:
Q: The number of leaves on apple seedlings aged 2 months followed a normal distribution, the average…
A: The question is about normal distribution Given : Avg. no. of of leaves on apple seedlings ( μ ) =…
Q: Please help with d, e, & f. The world's smallest mammal is the Kitti's hog-nosed bat, with a mean…
A: given dataμ=1.5σ=0.25normal distribution
Q: Someone interested in the number of miles Prof. St. John has run each day preparing for her next…
A:
Q: Susan has just completed her second semester in college. She earned a grade of A in her 2-hour…
A:
Q: Now suppose that you suffer from confirmation bias. You are pretty sure that it is going to be…
A: Hint: Use Baye's theorem to get the posterior probability. Then find the expected payoff using the…
Q: About 5% of a stores customers respond to advertised sales. The other 95% shop when they have time…
A: Hi! Thank you for the question, As per the honor code, we are allowed to answer three sub-parts at a…
Q: Two different people, acting independently, had to pick a number between 1 and 11, inclusive. What…
A: given data 2 persons acting independently, pick a number between 1 and 11 inclusive p(they had…
Q: Intelligence as measured by IQ score 136 is best described as
A: Hint: There are four types of measurement scales Nominal: it is a Categorical variable that…
Q: Tara McCoy is the office administrator for the Departmentof Management at State University. The…
A: Given The data is as follows: Average lead time, L¯=2 Standard deviation of lead time, σLT=0.5…
Q: Read and Understand "A look at the descriptive statistics for males and females show that male…
A: Population is the whole set of population used for study. Sample is the subset of population used…
Q: rcentile, P24, from the following data 1 3 5 12 15 18 25 27 34 37 40 42 43 46 49 51 53 56 64 72 74…
A: The given data is 1 3 5 12 15 18 25 27 34 37 40 42 43 46 49 51 53 56 64 72 74 81 86 90 92…
Q: (Refer to Krejcie and Morgan Table) Considering the 1, 200 students in the School of Teacher…
A: The provided information is as follows: Population size =1200Precision =95%
Q: How does the linear trend line forecasting model differfrom a linear regression model for…
A: The question is about regression model and forecasting model Introduction : Linear regression :…
Q: A student entering a doctoral program in educational psychology is required to select three courses…
A: Given: The list of courses is: EPR 695 EPR 654 EPR 646 EPR 699 EPR 668
Q: 2. The following is a distribution for the number of workers in 40 companies belonging to a certain…
A: The question is about frequency distribution Given : To find : 1 ) Q2 2 ) P75 3 ) PR50
Q: The world's smallest mammal is the Kitti's hog-nosed bat, with a mean weight of 1.5 grams and a…
A: as per Bartleby guideline expert have to answer first three Subparts only dear student please upload…
Q: 3. (Refer to Krejcie and Morgan Table) Considering the 1, 200 students in the School of Teacher…
A: Sample is the subset of population. Sampling is the method used to take sample from the population.…
Q: solve the second question please , last question in the picture
A: Hint: Use the Conditional Probability theorem as; P(A|B)=PA∩BP(B)
Q: The data table to the right represents the volumes of a generic soda brand. Complete parts (a) and…
A: The given data table represents the volumes of a generic soda brand.
Q: a) List all possible two-course selections. (b) Comment on the likelihood that EPR 679 and EPR 615…
A: course list: 643,658,679,604,615
Q: If a variable has a distribution that is bell-shaped with mean 28 and standard deviation 7, then…
A: Given,Mean(μ)=28standard deviation(σ)=7Empirical Rules:1) P(μ-σ<X<μ+σ)=68%2)…
Q: 53900 42400 33300 51100 37800 61700 48400 32400 29700 46100 74200 32100 50100 45100 66000 49400…
A: Class width is based on the minimum value, maximum value and the required number of classes. The…
Q: Data was collected for 300 fish from the North Atlantic. The length of the fish (in mm) is…
A: Concept: Upper and lower class limit is the highest and lowest value that can be taken in an…
Q: Time left 0:24:11 The item refers to the Table below which shows the scores obtained by ten students…
A:
Q: A sample of 200 people has a mean age of 21 with a population standard deviation (σ) of 5. Test the…
A: Given: Sample size(n)=200Sample mean(x¯)=21Population mean(μ)=18.9Population Standard deviation(σ)=5
Q: The barricade width of 25 glass 2-liter bottle was measured by an independent quality control…
A: Givensample size(n)=25Mean(x)=4.05standard deviation(s)=0.08confidence level=95%
Q: Risk and odds ratios 1/7: Patients immobilized for a substantial amount of time can develop deep…
A: WE will create the table DVT COMPLICATIONS NO COMPLICATIONS TOTAL placebo 73 1400 1473…
Q: Explain coefficient of determination?
A: In the regression equation, the dependent variable is interpreted to be best estimated through one…
Q: Choose the correct pie chart. O Executive search firms (E) Networking (N) Help-wanted ads (H) Mass…
A:
Q: Eight people took a test in which one can score only 1, 2, or 3. (a) You know that exactly two…
A: Hello! As you have posted 2 different questions, we are answering the first question. In case you…
Q: Question 4 Listen The MAPE of the linear regression method is 2.47% 6.78% 9.17% 2.63% 1 Year 2 3 4 5…
A: For the given data we use Excel calculations for the MAPE of the linear regression method. To find…
Q: IM Systems assembles microcomputers from generic com-ponents. It purchases its color monitors from a…
A: Given Lead time is 25 days Average daily demand, d¯=3.5 Standard deviation of daily demand, σd=1.2…
Q: Set up the structure for a statistical test to determine whether the data is normally distributed…
A: 5) A table is constructed for mean and standard deviation calculation: Lower Class Upper Class…
Q: (f) Some investigators believe that the effects of diet on cholesterol are more evident in people…
A: Here the given differences are Differences -14 -11 -9 1 7 9 11 12 12 15 18…
Q: ● ● (2) Make a frequency table to show the frequency with which you chose each response. (3) From…
A: Note: As per guidelines we will only answer the first three subparts, please repost other subparts…
Q: A concrete mix is designed to withstand 3000 pounds per square inch (psi) of pressure. The…
A: The following data has been given: 3970,4100,3100,3200,2950,3820,4100,4050,3470 We need to compute…
Q: The prior probabilities for two events A1 and A2 are P(A1) = .30 and P(A2) = .70. It is also known…
A: Given P(A1)=0.30, P(A2)=0.70, P(A1 and A2)=0 P(B/A1)=0.15, P(B/A2)=0.05 Note: According to…
Q: Use your graphing utility’s linear regression option to obtain a model of the form y = ax + b that…
A: Given data:
Q: 6) A student surveys some students on campus in the evening and finds that 16 out of 2 of the…
A: Given that: A student surveys some students in campus in the evening and find that 16 out of 20 of…
Q: mean 5 and variance 8/3
A: We have to find out three numbers with mean 5 and variance 8/3. We know mean is measure of Central…
Q: A highly selective boarding school will only admit students who place at least 2.5 standard…
A:
Q: Scores of an IQ test have a bell-shaped distribution with a mean of 100 and a standard deviation of…
A: The given mean is 100 and standard deviation is 19.
Q: The data represent the age of world leaders on their day of inauguration. Find the five-number…
A: Box plot is used to measure the shape of the distribution. It consists of five number summary values…
Q: (A) The population [N] and the sample [n] are similar in that they should be comprised of people…
A: A population is a set of all items or individuals of interest. It contains all members of a specific…
Q: The data given below show the number of overtime hours worked in one week per employee. Overtime…
A: Given: Overtime hours. Employees. 0 7 1 13 2 31 3 56 4 42 5 27 6 17
Q: Read and Understand A look at the descriptive statistics for males and Females show that male scores…
A: Given Information: Males: Mean m=2.85 Standard deviation SD=0.4 Females: Mean m=2.3 Standard…
Q: A random variable X follows a discrete distribution with support x = {−1,0, 1,2,3} and probability…
A: The support of the discrete random variable X is given by, χ = -1,0,1,2,3 So, PX ∈ χ =1 In other…

Step by step
Solved in 3 steps with 1 images

- The US. import of wine (in hectoliters) for several years is given in Table 5. Determine whether the trend appearslinear. Ifso, and assuming the trend continues, in what year will imports exceed 12,000 hectoliters?Table 3 gives the annual sales (in millions of dollars) of a product from 1998 to 20006. What was the average rate of change of annual sales (a) between 2001 and 2002, and (b) between 2001 and 2004?Table 6 shows the year and the number ofpeople unemployed in a particular city for several years. Determine whether the trend appears linear. If so, and assuming the trend continues, in what year will the number of unemployed reach 5 people?
- Table 4 gives the population of a town (in thousand) from 2000 to 2008. What was the average rate of change of population (a) between 2002 and 2004, and (b) between 2002 and 2006?Cable TV The following table shows the number C. in millions, of basic subscribers to cable TV in the indicated year These data are from the Statistical Abstract of the United States. Year 1975 1980 1985 1990 1995 2000 C 9.8 17.5 35.4 50.5 60.6 60.6 a. Use regression to find a logistic model for these data. b. By what annual percentage would you expect the number of cable subscribers to grow in the absence of limiting factors? c. The estimated number of subscribers in 2005 was 65.3million. What light does this shed on the model you found in part a?The U.S. Census tracks the percentage of persons 25 years or older who are college graduates. That data forseveral years is given in Table 4[14]. Determine whether the trend appears linear. If so, and assuming the trendcontinues. in what year will the percentage exceed 35%?
- DVD Player Sales The table shows the number of DVD players sold in a small electronics store in the years 2003-2013. Year DVD players sold 2003 495 2004 513 2005 410 2006 402 2007 520 2008 580 2009 631 2010 719 2011 624 2012 582 2013 635 aWhat was the average rate of change of sales between 2003 and 2013? bWhat was the average rate of change of sales between 2003 and 2004? cWhat was the average rate of change of sales between 2004 and 2005? dBetween which two successive years did DVD player sales increase most quickly? Decrease most quickly?Table 6 shows the population, in thousands, of harbor seals in the Wadden Sea over the years 1997 to 2012. a. Let x represent time in years starting with x=0 for the year 1997. Let y represent the number of seals in thousands. Use logistic regression to fit a model to these data. b. Use the model to predict the seal population for the year 2020. c. To the nearest whole number, what is the limiting value of this model?The table shows the sales revenue from the past 8 quarters. What is the 4-period moving average forecast of the next quarter? Year 1 Year 2 Year 3 Q1 Q2 Q3 Q4 Q1 Q2 Q3 Q4 Q1 11 10 9 12 10 7 7 11 ?
- hudson Marine has been an authorized dealer for c&d marine radios for the past sevenyears. the following table reports the number of radios sold each year.Year 1 2 3 4 5 6 7Number Sold 35 50 75 90 105 110 130a. construct a time series plot. does a linear trend appear to be present?b. Using Minitab or excel, develop a linear trend equation for this time series.c. Use the linear trend equation developed in part (b) to develop a forecast for annualsales in year 8.Consider the given data for the percent of participation of the 18-24-year-old group, y, as a function of years after 1964, x as below: year x y 1964 0 51.0 1968 4 50.0 1972 8 49.0 1976 12 42.0 1980 16 40.0 1984 20 42.0 1988 24 36.0 1992 28 44.0 1996 32 32.0 2000 36 32.0 2004 40 43.0 2008 44 45.0 2012 48 38.0 Create a linear model of the trend for the percent of participation of the 18-24-year-old group, y, as a function of years after 1964, x, using Desmos.The following table shows the average monthly production of coal in tonnes for the year 2010-2019. Year Production (in tonnes) Year Production (in tonnes) 2010 50.0 2015 38.1 2011 36.5 2016 32.6 2012 43.0 2017 41.7 2013 44.5 2018 41.1 2014 38.9 2019 33.8 Compute the price indices from 2010 to 2019 by taking 2019 as the base year. Compare the price of 2014 and 2017. What is the percentage (%) change in the production from 2016 to 2019?


