a) For the 25 participants, use the Frequencies option to produce output detailing the following measures: • Minimum age. Maximum age. Mean age. Standard deviation in the ages. Range of ages. Skewness in the ages. I Frequencies Statistics Age (years) of patient Valid 25 Missing Mean 41.24 Std. Deviation 20.102 Skewness .186 Std. Error of Skewness 464 Range 78 Minimum 4 Maximum 82 Figure 2. Table showing measures of central tendencies and measures of dispersion of participants ages b) Briefly describe the distribution of the ages of the participants as suggested by these summative measures.
a) For the 25 participants, use the Frequencies option to produce output detailing the following measures: • Minimum age. Maximum age. Mean age. Standard deviation in the ages. Range of ages. Skewness in the ages. I Frequencies Statistics Age (years) of patient Valid 25 Missing Mean 41.24 Std. Deviation 20.102 Skewness .186 Std. Error of Skewness 464 Range 78 Minimum 4 Maximum 82 Figure 2. Table showing measures of central tendencies and measures of dispersion of participants ages b) Briefly describe the distribution of the ages of the participants as suggested by these summative measures.

Glencoe Algebra 1, Student Edition, 9780079039897, 0079039898, 2018
18th Edition
ISBN:9780079039897
Author:Carter
Publisher:Carter
Chapter10: Statistics
Section10.6: Summarizing Categorical Data
Problem 23PPS

Related questions
Question
Transcribed Image Text:Task 2
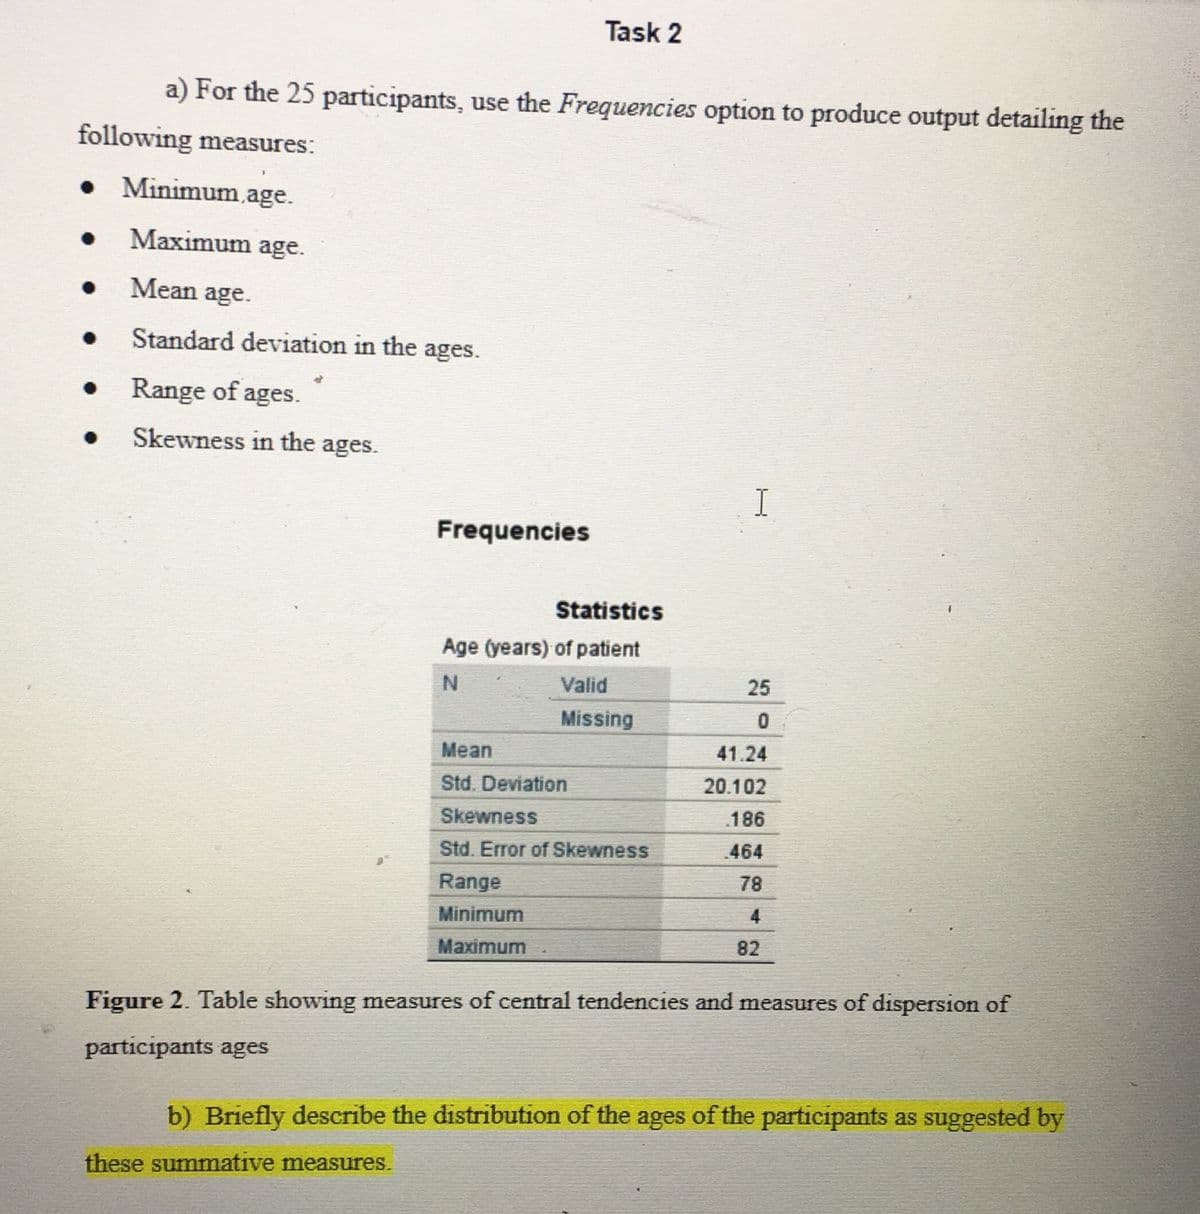
a) For the 25 participants, use the Frequencies option to produce output detailing the
following measures:
Minimum,age.
Maximum age.
Mean age.
Standard deviation in the ages.
Range of ages.
Skewness in the ages.
I
Frequencies
Statistics
Age (years) of patient
N
Valid
25
Missing
Mean
41.24
Std. Deviation
20.102
Skewness
186
Std. Error of Skewness
464
Range
78
Minimum
4
Maximum
82
Figure 2. Table showing measures of central tendencies and measures of dispersion of
participants ages
b) Briefly describe the distribution of the ages of the participants as suggested by
these summative measures.
Expert Solution
This question has been solved!
Explore an expertly crafted, step-by-step solution for a thorough understanding of key concepts.

Step by step
Solved in 2 steps with 2 images

Recommended textbooks for you
Glencoe Algebra 1, Student Edition, 9780079039897…
Algebra
ISBN:
9780079039897
Author:
Carter
Publisher:
McGraw Hill
Glencoe Algebra 1, Student Edition, 9780079039897…
Algebra
ISBN:
9780079039897
Author:
Carter
Publisher:
McGraw Hill