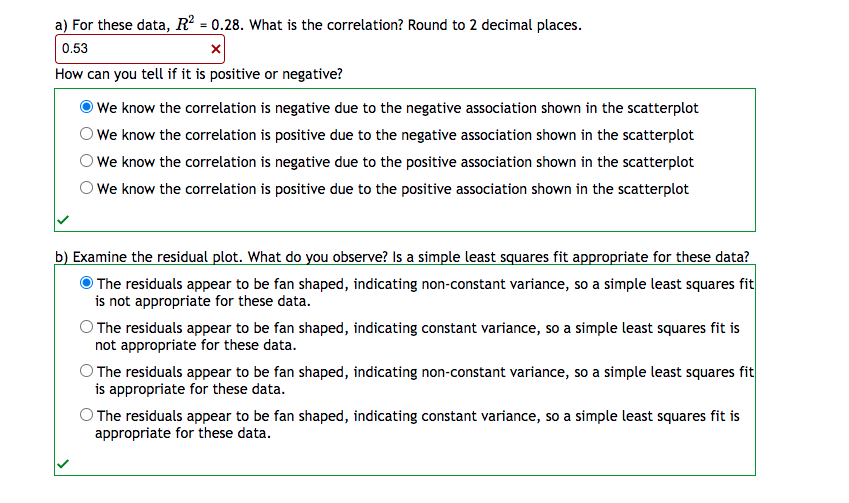
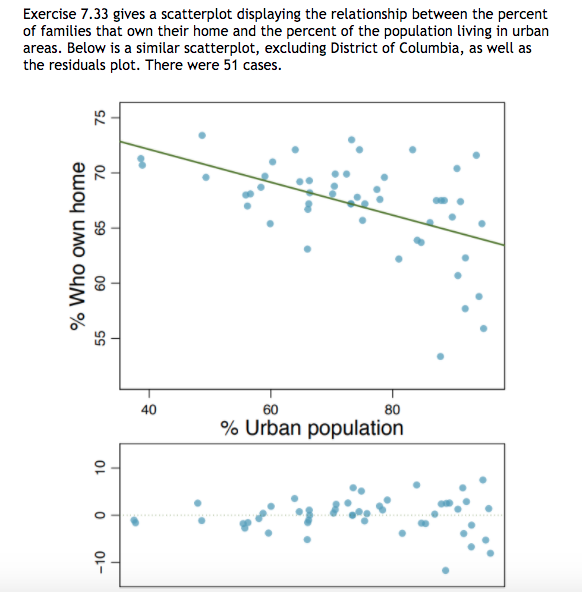
a) For these data, R² = 0.28. What is the correlation? Round to 2 decimal places. 0.53 How can you tell if it is positive or negative? O We know the correlation is negative due to the negative association shown in the scatterplot We know the correlation is positive due to the negative association shown in the scatterplot We know the correlation is negative due to the positive association shown in the scatterplot O We know the correlation is positive due to the positive association shown in the scatterplot b) Examine the residual plot. What do you observe? Is a simple least squares fit appropriate for these data? O The residuals appear to be fan shaped, indicating non-constant variance, so a simple least squares fit is not appropriate for these data. O The residuals appear to be fan shaped, indicating constant variance, so a simple least squares fit is not appropriate for these data. O The residuals appear to be fan shaped, indicating non-constant variance, so a simple least squares fit is appropriate for these data. O The residuals appear to be fan shaped, indicating constant variance, so a simple least squares fit is appropriate for these data.

Glencoe Algebra 1, Student Edition, 9780079039897, 0079039898, 2018
18th Edition
ISBN:9780079039897
Author:Carter
Publisher:Carter
Chapter10: Statistics
Section10.6: Summarizing Categorical Data
Problem 23PPS
icon
Related questions
icon
Concept explainers
Question
a) For these data, R? = 0.28. What is the correlation? Round to 2 decimal places.
0.53
How can you tell if it is positive or negative?
OWe know the correlation is negative due to the negative association shown in the scatterplot
O We know the correlation is positive due to the negative association shown in the scatterplot
O We know the correlation is negative due to the positive association shown in the scatterplot
O We know the correlation is positive due to the positive association shown in the scatterplot
b) Examine the residual plot. What do you observe? Is a simple least squares fit appropriate for these data?
O The residuals appear to be fan shaped, indicating non-constant variance, so a simple least squares fit
is not appropriate for these data.
O The residuals appear to be fan shaped, indicating constant variance, so a simple least squares fit is
not appropriate for these data.
O The residuals appear to be fan shaped, indicating non-constant variance, so a simple least squares fit
is appropriate for these data.
O The residuals appear to be fan shaped, indicating constant variance, so a simple least squares fit is
appropriate for these data.
Transcribed Image Text:a) For these data, R? = 0.28. What is the correlation? Round to 2 decimal places. 0.53 How can you tell if it is positive or negative? OWe know the correlation is negative due to the negative association shown in the scatterplot O We know the correlation is positive due to the negative association shown in the scatterplot O We know the correlation is negative due to the positive association shown in the scatterplot O We know the correlation is positive due to the positive association shown in the scatterplot b) Examine the residual plot. What do you observe? Is a simple least squares fit appropriate for these data? O The residuals appear to be fan shaped, indicating non-constant variance, so a simple least squares fit is not appropriate for these data. O The residuals appear to be fan shaped, indicating constant variance, so a simple least squares fit is not appropriate for these data. O The residuals appear to be fan shaped, indicating non-constant variance, so a simple least squares fit is appropriate for these data. O The residuals appear to be fan shaped, indicating constant variance, so a simple least squares fit is appropriate for these data.
Exercise 7.33 gives a scatterplot displaying the relationship between the percent
of families that own their home and the percent of the population living in urban
areas. Below is a similar scatterplot, excluding District of Columbia, as well as
the residuals plot. There were 51 cases.
40
60
80
% Urban population
% Who own home
-10
55
65
75
09
OL
Transcribed Image Text:Exercise 7.33 gives a scatterplot displaying the relationship between the percent of families that own their home and the percent of the population living in urban areas. Below is a similar scatterplot, excluding District of Columbia, as well as the residuals plot. There were 51 cases. 40 60 80 % Urban population % Who own home -10 55 65 75 09 OL
Expert Solution
trending now

Trending now

This is a popular solution!

steps

Step by step

Solved in 3 steps

Blurred answer
Knowledge Booster
Correlation, Regression, and Association
Learn more about
Need a deep-dive on the concept behind this application? Look no further. Learn more about this topic, statistics and related others by exploring similar questions and additional content below.
Recommended textbooks for you
Glencoe Algebra 1, Student Edition, 9780079039897…
Algebra
ISBN:
9780079039897
Author:
Carter
Publisher:
McGraw Hill
Linear Algebra: A Modern Introduction
Algebra
ISBN:
9781285463247
Author:
David Poole
Publisher:
Cengage Learning
Big Ideas Math A Bridge To Success Algebra 1: Stu…
Algebra
ISBN:
9781680331141
Author:
HOUGHTON MIFFLIN HARCOURT
Publisher:
Houghton Mifflin Harcourt