(a) Formulate the hypotheses that can be used to determine whether the sample data support the hypothesis that students show a higher population mean math score on the SAT if their parents attained a higher level of education. (Let #₁ = population mean verbal score of students whose parents are college graduates with a bachelor's degree and μ₂ = population me verbal score of students whose parents are high school graduates but do not have a college degree.) O Ho: H1 - M2 # 0 На: M1 - M2 = 0 Ho: М1 - M2 = 0 Ha: H1 - M2 # 0 Ho: M₁-1₂ 20 Hai Hi H2 < 0 Ho: M₁ M₂ ≤0 на: H1 - H2>0 , но H1 - H2<0 на: М1 - м2 = 0 (b) What is the point estimate of the difference between the means for the two populations? (c) Find the value of the test statistic. (Round your answer to three decimal places.) Compute the p-value for the hypothesis test. (Round your answer to four decimal places.) p-value=
(a) Formulate the hypotheses that can be used to determine whether the sample data support the hypothesis that students show a higher population mean math score on the SAT if their parents attained a higher level of education. (Let #₁ = population mean verbal score of students whose parents are college graduates with a bachelor's degree and μ₂ = population me verbal score of students whose parents are high school graduates but do not have a college degree.) O Ho: H1 - M2 # 0 На: M1 - M2 = 0 Ho: М1 - M2 = 0 Ha: H1 - M2 # 0 Ho: M₁-1₂ 20 Hai Hi H2 < 0 Ho: M₁ M₂ ≤0 на: H1 - H2>0 , но H1 - H2<0 на: М1 - м2 = 0 (b) What is the point estimate of the difference between the means for the two populations? (c) Find the value of the test statistic. (Round your answer to three decimal places.) Compute the p-value for the hypothesis test. (Round your answer to four decimal places.) p-value=

Glencoe Algebra 1, Student Edition, 9780079039897, 0079039898, 2018
18th Edition
ISBN:9780079039897
Author:Carter
Publisher:Carter
Chapter10: Statistics
Section10.3: Measures Of Spread
Problem 1GP

Related questions
Question
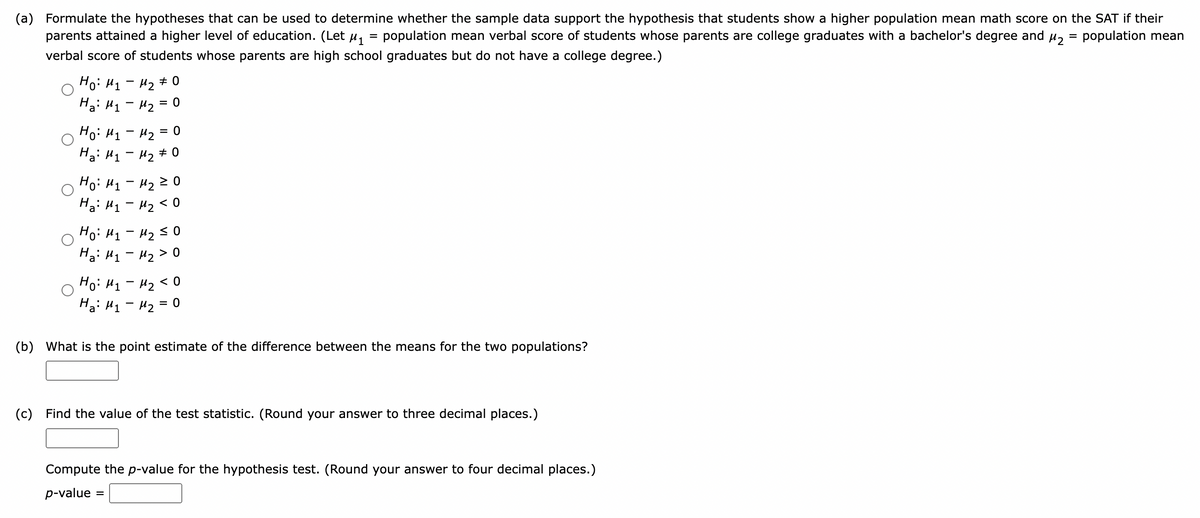
Transcribed Image Text:(a) Formulate the hypotheses that can be used to determine whether the sample data support the hypothesis that students show a higher population mean math score on the SAT if their
parents attained a higher level of education. (Let μ₁ population mean verbal score of students whose parents are college graduates with a bachelor's degree and μ₂ = population mean
verbal score of students whose parents are high school graduates but do not have a college degree.)
Ho: M₁ M₂ #0
На: M1 - M2 0
Ho: M₁
Ha: M₁
= 0
M₂ =
M₂ #0
Ho: M₁ M₂ 20
Ha Hy - H2 < 0
но: H1-M250
На: M1 - M2 > 0
-
Ho: M₁ M₂ <0
H₂: M₁ M₂ = 0
(b) What is the point estimate of the difference between the means for the two populations?
(c) Find the value of the test statistic. (Round your answer to three decimal places.)
Compute the p-value for the hypothesis test. (Round your answer to four decimal places.)
p-value =
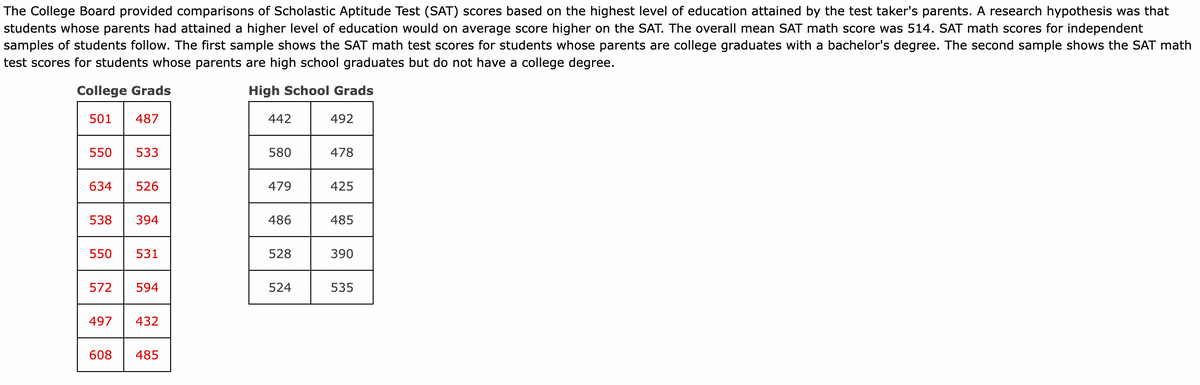
Transcribed Image Text:The College Board provided comparisons of Scholastic Aptitude Test (SAT) scores based on the highest level of education attained by the test taker's parents. A research hypothesis was that
students whose parents had attained a higher level of education would on average score higher on the SAT. The overall mean SAT math score was 514. SAT math scores for independent
samples of students follow. The first sample shows the SAT math test scores for students whose parents are college graduates with a bachelor's degree. The second sample shows the SAT math
test scores for students whose parents are high school graduates but do not have a college degree.
High School Grads
College Grads
501
487
550
634
538
550
572
497
533
526
394
531
594
432
608 485
442
580
479
486
528
524
492
478
425
485
390
535
Expert Solution
This question has been solved!
Explore an expertly crafted, step-by-step solution for a thorough understanding of key concepts.

This is a popular solution!

Trending now
This is a popular solution!

Step by step
Solved in 2 steps

Recommended textbooks for you
Glencoe Algebra 1, Student Edition, 9780079039897…
Algebra
ISBN:
9780079039897
Author:
Carter
Publisher:
McGraw Hill

Holt Mcdougal Larson Pre-algebra: Student Edition…
Algebra
ISBN:
9780547587776
Author:
HOLT MCDOUGAL
Publisher:
HOLT MCDOUGAL

College Algebra (MindTap Course List)
Algebra
ISBN:
9781305652231
Author:
R. David Gustafson, Jeff Hughes
Publisher:
Cengage Learning
Glencoe Algebra 1, Student Edition, 9780079039897…
Algebra
ISBN:
9780079039897
Author:
Carter
Publisher:
McGraw Hill
Holt Mcdougal Larson Pre-algebra: Student Edition…
Algebra
ISBN:
9780547587776
Author:
HOLT MCDOUGAL
Publisher:
HOLT MCDOUGAL
College Algebra (MindTap Course List)
Algebra
ISBN:
9781305652231
Author:
R. David Gustafson, Jeff Hughes
Publisher:
Cengage Learning