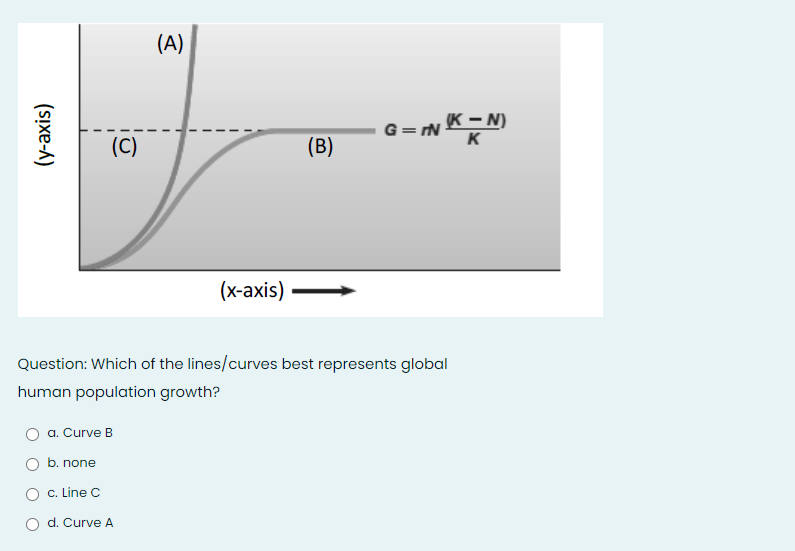
(A) G = rN K – N) K (C) (B) (x-axis) Question: Which of the lines/curves best represents global human population growth? a. Curve B b. none O c. Line C O d. Curve A (y-axis)


Q: A distinguishing characteristic of Eukaryotes is that they contain membrane-enclosed organelles and…
A: The presence of a nucleus distinguishes eukaryotes from prokaryotes. Eukaryota is one of the three…
Q: Choose a situation on how an organism (plant/animal) maintains homeostasis.
A: Introduction :- Homeostasis is the tendency to maintain a stable, relatively consistent internal…
Q: Which of the following individuals would most benefit from a low sodium diet? O a. Joey is a 5 year…
A: Introduction :- A systolic pressure of less than 120 and a diastolic pressure of less than 80 is…
Q: Of the circled parts, determine which is/are parenchyma cells 3 2
A: Introduction Plant tissue is made up of a group of similar cells that serve a specific purpose for…
Q: Explain the steps involved in translocation of sucrose.
A: Xylem and phloem are the vascular tissues present in the vascular plants.
Q: Which of the following options best depicts the flow of information when a gene directs the…
A: The journey from a gene to a cellular component (proteins) is a complex process and is strictly…
Q: 11. An eosinophil is classified as a A. Red blood cell B White blood cell C. Platelet D. Hemoglobin…
A: Blood is a kind of connective tissue. It connects different body parts. The blood transports gases…
Q: Name the tissues that compose a typical root, and compare theirarrangement in monocot and eudicot…
A: * A typical root formed by 3 layer of tissues that is the outermost epidermis tissue, middle cortex…
Q: A person with diabetes cannot regulate their blood sugar because their pancreas does not release…
A: If you have diabetes: Your glucose levels will continue to rise after you eat because there's not…
Q: You are counting white blood cells in a freshly drawn blood sample. You dilute the blood 1/20 in 5%…
A: The answer is option D.8.7×10 power 6.
Q: 8. DNA basic structure: Below, I have drawn a representation of a single strand of DNA. Draw a…
A: The self replicating molecules that are present in the chromosomes and carry genetic information are…
Q: STRUCTURE STAINING IMPORTANT EVENTS OF DEVELOPMENT Proerythroblast Basophilic erythroblast…
A: There are few important points : Blood is a connective tissue composed of liquid extracellular…
Q: You are counting white blood cells in a freshly drawn blood sample. You dilute the blood 1/20 in 5%…
A:
Q: The example that relates to the law of supply and demand and mention the ways opted by the humans…
A: Natural resources provided by the biosphere meet the basic needs of over six billion people. Human…
Q: Construct a schematic diagram on how ACE inhibition assay is performed based on the protocol given.…
A: k to library ACE Inhibition Assay Use in OneLab Abstract Overview Protocol Contact info OneLab is a…
Q: Why do anisogamous organisms only experience the twofold cost of sex?
A: Anisogamy is a type of sexual reproduction that involves the union or fusion of two gametes that…
Q: Arrestin has a mutation that prevents it from binding the GPCR receptor in the PLC pathway. How…
A: Arrestins These are also referred as Arr. These are proteins that are involved in vital signal…
Q: Type sentence 1 here macronutrient covalent bond cell membrane Type sentence 2 here cell wall…
A: Sentence 1 - Macronutrients such as Carbohydrates are covalently bonded to proteins or lipids…
Q: A plant that grows very close to the ground, tends to be small in size, favors moist environments…
A: Given: Plants are the primary source of nutrients for all living organisms. Plants take sunlight for…
Q: Below is a Figure of a Leaf Epidermis, Determine what is structure X? A.Stomata B. Stomatal…
A: Stomata are small pores present in the epidermis of leaves. They regulate the process of…
Q: AT ELEVATED PRESSURE NITROGEN HAS AN EFFECT 1. causes oxygen starvation 2. leads to the formation of…
A: Answer
Q: Where is the actual exchange of oxygen and carbon dioxide take place?* a. Veins b.…
A: Artery, vein and capillary are three types of blood vessels in our body. They facilitate the blood…
Q: Assume that we want to minimize a function using evolutionary algorithm. For our coding process, we…
A: Let us assume number of slots in roulette is 38 Where C1 occur 5 times Therefore getting C1 =…
Q: The cortical nephron is characterized by all of the following except: a. short nephron loop…
A: Kidneys- they are a pair of organs that belong to the urinary/excretory system. They are bean-shaped…
Q: Why do anisogamous organisms only experience the twofold cost of sex?
A: Isogamous sexual reproduction occurs when male and female gametes have similar morphology. They are…
Q: The shape of a pumpkin is determined by the action of two genes A and B. The recessive forms of…
A: Given When both alleles are heterozygous a disc-shaped pumpkin is produced. homozygous dominant at…
Q: 10 13 2 16 CERVICAL (coudal view)
A: There is one cervical vertebra present in frog (the atlas is the only cervical vertebra in the frog.…
Q: With only one exception, the most commonly used STR loci are spread across the human genome, each on…
A: The most common short tandem repeat (STRs) inside the human genome are dinucleotide repeats. STR…
Q: What is STD? in 3 paragraphs (Introduction, Body and Conclusion)
A: Answer
Q: Openings in the plant body to allow for gas exchange are termed palisade cells collenchyma stomata O…
A: ANSWER;- Stomata Explain;- These are the little pores in plant stems or leaves that permit carbon…
Q: All of these materials are needed for translation EXCEPT: O A) TRNA O B) ribosomes C) RNA polymerase…
A: Translation, in molecular genetics, is the mechanism by which ribosomes in the cytosol or…
Q: differentiate a nodule from a root gall? (
A:
Q: Which of the following statement does NOT conform why cardiovascular diseases (CVD) are considered…
A: The term cardiovascular disease refers to any ailment that affects the heart or blood vessels. It's…
Q: Micelles are found Group of answer choices within the lumen of the small intestine within the…
A: Adoption of fat refers to the process whereby the end product of fat digestion passes through the…
Q: 1. Transcription: Write out the sequence of mRNA that would result from transcription of the…
A: The gene is expressed from DNA into protein by Central Dogma. The transcription and translation…
Q: All life forms on Earth depend on plants in order to exist. Give three reasons that support this…
A: In order exist on earth every living organisms required certain things like food, water, sunlight…
Q: #1 #2 N N-H ON H-N IN
A: Introduction From unicellular protozoans to multicellular plants and animals, life on Earth is…
Q: As tubular filtrate flows down the descending limb of the loop of Henle, it becomes: O hypoosmotic O…
A: Water gradually diffuses out from the descending Henle loop. The solvents in the filtrate are…
Q: You have counted a total of 6.4 x 10° cells /ml in preparation for plating cells at a concentration…
A: The answer is 1.17 mL of cells and 3.83 mL of medium
Q: Referring to the figure, what bases will be added to the primer as DNA replication proceeds? 5'[a]3'…
A: In a DNA molecule, the bases on the opposite strands are paired complementary to each other. A…
Q: True or False. If drug A produces a larger zone of inhibition than drug B on the Kirby-Bauer disk…
A: Introduction If drug A does produce a larger zone of inhibition, that is one positive attribute of…
Q: This protein adduct can hold (tether) a peripheral membrane protein to the cell membrane: A) A fatty…
A: Ionic linkages peripheral membrane protein or interactions with the polar head regions of the…
Q: To explain: Why the patients with severe liver disease often have impaired blood clotting.
A: The liver, one of the major organs in the human body, is in charge of fat metabolism. It also plays…
Q: This muscle moves the eyeball upward. 1) superior rectus 2) lateral rectus 3) inferior oblique 4)…
A: The eye is a sensory organ that aids in the perception of sight or vision. The eyeball and various…
Q: Which is NOT a modification made to pre-mRNA? addition of a 5' cap removal of introns addition of a…
A: The mRNA is produced by the process of transcription. It takes place in the nucleus. The RNA…
Q: Determine whether each of the following traits are the result of convergent evolution?
A: Convergent evolution is the process where distantly related organisms independently evolve from…
Q: Which of the following cells secretes the enzymes - gastric lipase and pepsin ogen? Group of answer…
A: Mucous neck cells: These basically located in gastric glands. These contain less mucin in apical…
Q: malaria
A: Malaria : Malaria is an infection caused by a few plasmodium species which are single celled…
Q: The following strand is a template strand: 3-АТСТАСССТТCGACTAGAАСААСТ-5' The non-template strand is…
A: Given, Template strand : 3'-ATCTACCCTTCGACTAGAACAACT-5'
Q: Describe evidence supporting the hypothesis that red algae and green algae should be included in a…
A: Monophyletic groups are the ones that include all the descendants of a common ancestor.


Step by step
Solved in 3 steps


- What do bioarchaeologists do? A. None of these are correct B. They identify population trends by looking at prehistoric living structures. C. They identify population trends by looking at skeletal material. D. They only look at ancient artifacts to study past populations.A population that grew in close relation to the amount of resources available in the environment, would experience A. exponential growth, such as shown on the J-shaped curve B. logistic growth, such as shown on the S-shaped curve C. unpredictable growth, such as shown on the ?-shaped curve D.logistic growth, such as shown on the J-shaped curve E. exponential growth, such as shown on the S-shaped curveIn a graph of population size versus time, a J-shaped curve is characteristic of (a) exponential population growth (b) logistic population growth (c) zero population growth (d) replacement-level fertility (e) population growth momentum
- A population of bats in a local zoo demonstrates geometric growth. The initial population size is 43 bats. During that year, 77 bats are born, and 21 bats are lost to accidents and predators. a. Determine the geometric growth rate (λ). Show your work. b. Do you assume that the population will continue to increase at this rate? Explain how you made this conclusion.What do bioarchaeologists do? A. They identify population trends by looking at skeletal material. B. They only look at ancient artifacts to study past populations. C. None of these are correct D. They identify population trends by looking at prehistoric living structures.Use this graph of the idealized exponential and logistic growth curves to complete the following. a. Label the axes and curves on the graph.b. What does the dotted line represent? c. For each curve, indicate and explain where population growth is the most rapid. d. Which of these curves better represents global human population growth?
- Assume that the population of the greater roadrunner in the Guadelope Desert was 250 per hectare at the beginning of 1999. If the carrying capacity, K , is 750 and r=0.25 per year, what is the number ofroadrunners: (a) after a year later, (b) ten years later, (c) after a score, (d) a century later, and (e) a millennium later?A population that did not grow in close relation to the amount of resources available in the environment, and dramatically overshot the carrying capacity, would experience: A. logistic growth, such as shown on the S-shaped curve B. exponential growth, such as shown on the J-shaped curve C. unpredictable growth, such as shown on the ?-shaped curve D. exponential growth, such as shown on the S-shaped curve E.logistic growth, such as shown on the J-shaped curveA continuously growing population of alligators has a population size of 1,000 and an intrinsic rate of increase of r= 0.05 per year. Assuming that this rate of increase remains the same, about how long should it take for the population to reach 4000?
- The growth of a population of rare South American beetles is given by the logistic function with k = 0.00001 and t in months. Assume that there are 200 beetles initially and that the maximum population size is 10,000. a. Find the growth function G1t2 for these beetles. Find the population and rate of growth of the population after the following times. b. 6 months c. 3 years d. 7 years e. What happens to the rate of growth over time?Meta population models focus on the BIDE (birth, immigration, death, emigration) dynamics, colonization and extirpation. A) Explain how these relate to genetic bottlenecks and explain why meta population models have a hard time predicting such events? B) Why is the island biogeography model a strong example of meta population dynamics?Japan currently exhibits which of the following age-structures (population profiles)? A. the column population profile B. the inverted pyramid population profile C. the bulge population profile D. the pyramid population profile E. all of the above