A gambler complained about the dice. They seemed to be loaded! The dice were taken off the table and tested one at a time. One die was rolled 300 times and the following frequencies were recorded. Outcome 1 2 3 4 5 6 Observed 60 44 66 33 51 46 frequency 0 Do these data indicate that the die is unbalanced? Use a 1% level of significance. Hint: If the die is balanced, all outcomes should have the same expected frequency. (a) What is the level of significance? State the null and alternate hypotheses. O Ho: The distributions are different. H,: The distributions are different. O Ho: The distributions are the same. H: The distributions are the same. O Ho: The distributions are the same. H: The distributions are different. O Hn: The distributions are different. H: The distributions are the same. (b) Find the value of the chi-square statistic for the sample. (Round the expected frequencies to at least three decimal places. Round the test statistic to three decimal places.) Are all the expected frequencies greater than 5? O Yes O No What sampling distribution will you use? O uniform O normal O Student's t O chi-square What are the degrees of freedom?
A gambler complained about the dice. They seemed to be loaded! The dice were taken off the table and tested one at a time. One die was rolled 300 times and the following frequencies were recorded. Outcome 1 2 3 4 5 6 Observed 60 44 66 33 51 46 frequency 0 Do these data indicate that the die is unbalanced? Use a 1% level of significance. Hint: If the die is balanced, all outcomes should have the same expected frequency. (a) What is the level of significance? State the null and alternate hypotheses. O Ho: The distributions are different. H,: The distributions are different. O Ho: The distributions are the same. H: The distributions are the same. O Ho: The distributions are the same. H: The distributions are different. O Hn: The distributions are different. H: The distributions are the same. (b) Find the value of the chi-square statistic for the sample. (Round the expected frequencies to at least three decimal places. Round the test statistic to three decimal places.) Are all the expected frequencies greater than 5? O Yes O No What sampling distribution will you use? O uniform O normal O Student's t O chi-square What are the degrees of freedom?

MATLAB: An Introduction with Applications
6th Edition
ISBN:9781119256830
Author:Amos Gilat
Publisher:Amos Gilat
Chapter1: Starting With Matlab
Section: Chapter Questions
Problem 1P

Related questions
Question
100%
A gambler complained about the dice. They seemed to be loaded! The dice were taken off the table and tested one at a time. One die was rolled 300 times and the following frequencies were recorded.
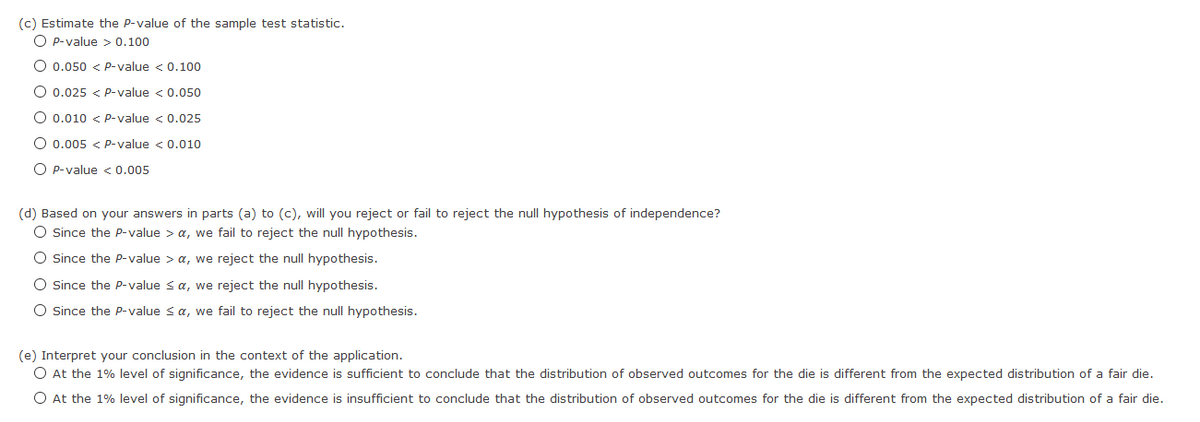
Transcribed Image Text:(c) Estimate the P-value of the sample test statistic.
O P-value > 0.100
O 0.050 < Pp-value < 0.100
O 0.025 < P-value < 0.050
O 0.010 < Pp-value < 0.025
O 0.005 < P-value < 0.010
O P-value < 0.005
(d) Based on your answers in parts (a) to (c), will you reject or fail to reject the null hypothesis of independence?
O since the P-value > a, we fail to reject the null hypothesis.
O Since the P-value > a, we reject the null hypothesis.
O Since the P-value sa, we reject the null hypothesis.
O Since the P-value sa, we fail to reject the null hypothesis.
(e) Interpret your conclusion in the context of the application.
O At the 1% level of significance, the evidence is sufficient to conclude that the distribution of observed outcomes for the
is different from the expected distribution of a fair die.
O At the 1% level of significance, the evidence is insufficient to conclude that the distribution of observed outcomes for the die is different from the expected distribution of a fair die.
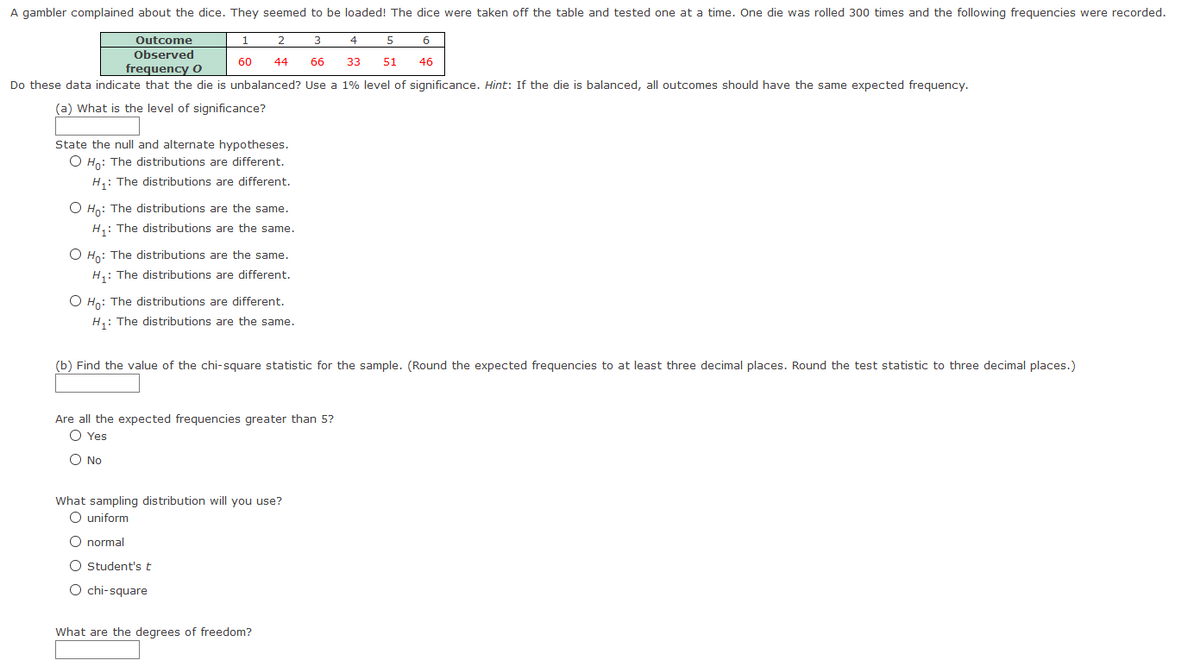
Transcribed Image Text:A gambler complained about the dice. They seemed to be loaded! The dice were taken off the table and tested one at a time. One die was rolled 300 times and the following frequencies were recorded.
Outcome
1
3
4
6
Observed
60
44
66
33
51
46
frequency O
Do these data indicate that the die is unbalanced? Use a 1% level of significance. Hint: If the die is balanced, all outcomes should have the same expected frequency.
(a) What is the level of significance?
State the null and alternate hypotheses.
O Ho: The distributions are different.
H,: The distributions are different.
O Ho: The distributions are the same.
H,: The distributions are the same.
O Ho: The distributions are the same.
H,: The distributions are different.
O Ho: The distributions are different.
H,: The distributions are the same.
(b) Find the value of the chi-square statistic for the sample. (Round the expected frequencies to at least three decimal places. Round the test statistic to three decimal places.)
Are all the expected frequencies greater than 5?
O Yes
O No
What sampling distribution will you use?
O uniform
O normal
O Student's t
O chi-square
What are the degrees of freedom?
Expert Solution
This question has been solved!
Explore an expertly crafted, step-by-step solution for a thorough understanding of key concepts.

This is a popular solution!

Trending now
This is a popular solution!

Step by step
Solved in 2 steps with 7 images

Knowledge Booster


Learn more about
Need a deep-dive on the concept behind this application? Look no further. Learn more about this topic, statistics and related others by exploring similar questions and additional content below.Recommended textbooks for you
MATLAB: An Introduction with Applications
Statistics
ISBN:
9781119256830
Author:
Amos Gilat
Publisher:
John Wiley & Sons Inc

Probability and Statistics for Engineering and th…
Statistics
ISBN:
9781305251809
Author:
Jay L. Devore
Publisher:
Cengage Learning

Statistics for The Behavioral Sciences (MindTap C…
Statistics
ISBN:
9781305504912
Author:
Frederick J Gravetter, Larry B. Wallnau
Publisher:
Cengage Learning
MATLAB: An Introduction with Applications
Statistics
ISBN:
9781119256830
Author:
Amos Gilat
Publisher:
John Wiley & Sons Inc
Probability and Statistics for Engineering and th…
Statistics
ISBN:
9781305251809
Author:
Jay L. Devore
Publisher:
Cengage Learning
Statistics for The Behavioral Sciences (MindTap C…
Statistics
ISBN:
9781305504912
Author:
Frederick J Gravetter, Larry B. Wallnau
Publisher:
Cengage Learning

Elementary Statistics: Picturing the World (7th E…
Statistics
ISBN:
9780134683416
Author:
Ron Larson, Betsy Farber
Publisher:
PEARSON

The Basic Practice of Statistics
Statistics
ISBN:
9781319042578
Author:
David S. Moore, William I. Notz, Michael A. Fligner
Publisher:
W. H. Freeman

Introduction to the Practice of Statistics
Statistics
ISBN:
9781319013387
Author:
David S. Moore, George P. McCabe, Bruce A. Craig
Publisher:
W. H. Freeman