A) Given the following set of data, plot the chromatogram (absorbance versus volume of eluate). Vol of eluate (mL) Abs (560 nm) 0.5 0.182 1 0.108 1.5 0.042 2 0.02 2.5 0.015 3 0.083 3.5 0.052 4 0.03 4.5 0.011 5 0.004 5.5 6. 0.001 6.5 0.001
A) Given the following set of data, plot the chromatogram (absorbance versus volume of eluate). Vol of eluate (mL) Abs (560 nm) 0.5 0.182 1 0.108 1.5 0.042 2 0.02 2.5 0.015 3 0.083 3.5 0.052 4 0.03 4.5 0.011 5 0.004 5.5 6. 0.001 6.5 0.001

Chapter26: Molecular Absorption Spectrometry
Section: Chapter Questions
Problem 26.1QAP

Related questions
Question
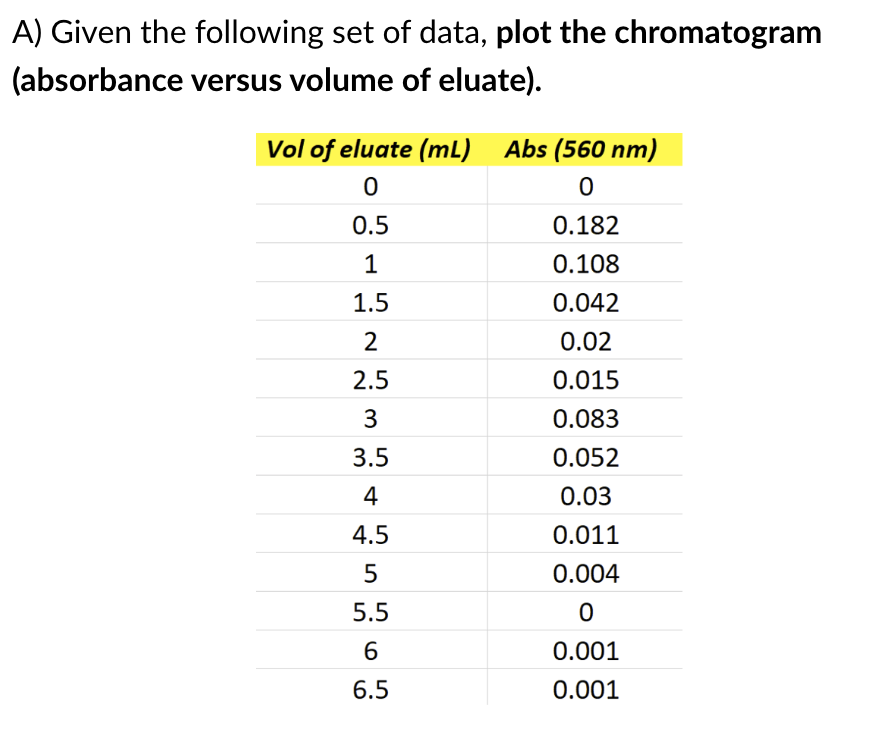
Transcribed Image Text:A) Given the following set of data, plot the chromatogram
(absorbance versus volume of eluate).
Vol of eluate (mL) Abs (560 nm)
0.5
0.182
1
0.108
1.5
0.042
2
0.02
2.5
0.015
3
0.083
3.5
0.052
4
0.03
4.5
0.011
0.004
5.5
6.
0.001
6.5
0.001
Expert Solution
This question has been solved!
Explore an expertly crafted, step-by-step solution for a thorough understanding of key concepts.

Step by step
Solved in 2 steps with 1 images

Knowledge Booster


Learn more about
Need a deep-dive on the concept behind this application? Look no further. Learn more about this topic, chemistry and related others by exploring similar questions and additional content below.Recommended textbooks for you

Chemistry & Chemical Reactivity
Chemistry
ISBN:
9781337399074
Author:
John C. Kotz, Paul M. Treichel, John Townsend, David Treichel
Publisher:
Cengage Learning

Chemistry & Chemical Reactivity
Chemistry
ISBN:
9781133949640
Author:
John C. Kotz, Paul M. Treichel, John Townsend, David Treichel
Publisher:
Cengage Learning
Chemistry & Chemical Reactivity
Chemistry
ISBN:
9781337399074
Author:
John C. Kotz, Paul M. Treichel, John Townsend, David Treichel
Publisher:
Cengage Learning
Chemistry & Chemical Reactivity
Chemistry
ISBN:
9781133949640
Author:
John C. Kotz, Paul M. Treichel, John Townsend, David Treichel
Publisher:
Cengage Learning

Principles of Instrumental Analysis
Chemistry
ISBN:
9781305577213
Author:
Douglas A. Skoog, F. James Holler, Stanley R. Crouch
Publisher:
Cengage Learning