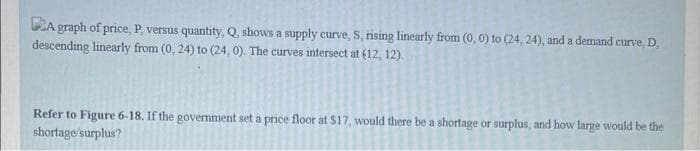
A graph of price, P, versus quantity, Q, shows a supply curve, S, rising linearly from (0, 0) to (24, 24), and a demand curve, D, descending linearly from (0, 24) to (24, 0). The curves intersect at (12, 12). Refer to Figure 6-18. If the government set a price floor at $17, would there be a shortage or surplus, and how large would be the shortage/surplus?


Q: If nco>0 greater than zero do we say nco is positive? When we way nco>0 means that we have…
A: DISCLAIMER “Since you have asked multiple questions, we will solve the first three questions for…
Q: Refer to the information provided in Figure 34.1 below to answer the question(s) that follow.…
A: In a closed economy, export and import are zero. Hence, aggregate expenditure is the sum of…
Q: Explain the difference between a pegged exchange rate system and a floating exchange rate system.…
A: A nominal exchange rate that has been firmly established by the monetary authority concerning a…
Q: 2) Lagrange Multiplier Problem: Explain the Lagrange Multiplier technique for constrained…
A:
Q: 8. Given the following set of demand and supply functions, find the equilibrium price and…
A: The equilibrium price and quantity could be measured by equating demand and supply equations.
Q: 12. Which of the following statements is correct? a. An increases in the level of autonomous…
A: Since you have asked multiple questions, we are solving only the first question for you. To get…
Q: A company is considering the purchase of either machine A or machine B. And the interest rate is…
A: Present worth analysis for cost alternative: In a present worth analysis of cost alternatives, the…
Q: Question 3: Represent Rock-Paper-Scissors game in a matrix format. Note that the winner gets 1…
A: The strategy where one player chooses a particular action irrespective of the other player's action…
Q: In the following games, all payoffs are listed with the row player's payoffs first and the column…
A: A mixed strategy of a player is the probability distribution of randomly selecting a strategy among…
Q: x Amir and Beatrice play the following game. Amir offers an amount of money € [0, 1] to Beatrice.…
A: Let's take There are 2 player Amir and Beatrice Let's take Amir---A Beatrice ---B X --(0,1)---…
Q: Consider a social security system which taxes the young a tax t in period t to pay the old a subsidy…
A: Budget Constraint is a function relating expenditure to the income of an entity or individual which…
Q: Which of these does NOT explain the diamond-water paradox?
A: introduction The water-diamond paradox is one of the classic economic problems that has been…
Q: An African family that consumes W gallons of water every year, more or less the same amount every…
A: Given: Gallons of water consumed every year = W Price of water = Pw dollars per gallon. Ever time…
Q: Determine which of the three principle sources of wage differentials is most likely to account for…
A: Introduction A wage is payment made by an employer to an employee for work done in a specific…
Q: Referring to the graph below: a. Is this firm operating in the long run? How do you know? b. What…
A: In perfect competition, In long run , a firm will produce where P = MR = MC = ATC So, There will…
Q: Using the table above, compute ure and identify the macroeconomic
A: Aggregate expenditure is the sum of consumption, planned investment, government spending, and net…
Q: Based on your current quantities and costs, can you sell a hamburger for $2 and still make a profit?
A: Profit refers to the money you have left after paying for business spending. There are 3 main types…
Q: he transfer payments multiplier is ________ than the government purchases multiplier because some…
A: Government spending multiplier = 1 / (1-MPC) Transfer payment multiplier = MPC / (1-MPC) Where MPC…
Q: Three players bargain over the division of 1 dollar. There are at most three rounds of bargain- ng.…
A: The technique of determining the appropriate course of action by working backwards in time from the…
Q: Price and costs (dollars per unit) $50 $40 $30 $20 $10 0 30 60 MR 90 D MC ATC 120 150 180 Quantity…
A: Under monopolistic competition, the profit will maximize when the marginal revenue (MR) is equal to…
Q: Suppose that technological change creates economies of scope between two products. One product is…
A: The production of products and services lead to generating some production cost. The level of…
Q: 13 Suppose that GDP in Newland is $700 billion and the government increases spending by $30 billion.…
A: Money demanded at different interest rate is represented money demand curve .The supply of money at…
Q: 3 mutually exclusive projects A, B, C. What will be selected? Project Capital (mil.) NPV (mil.) A 1…
A: Present value is the value of investment in today's dollar. Future value is the value of investment…
Q: As in the lemons model, suppose that there is one seller and one buyer who may exchange a good of…
A: Lemon model: 1 seller, 1 buyer Value of good for seller = v Value of good for buyer = 3v/2 Fixed…
Q: Amir and Beatrice play the following game. Amir offers an amount of money r € [0, 1] to Beatrice.…
A: Let's take There are 2 player Amir and Beatrice Let's take Amir---A Beatrice ---B X --(0,1)---…
Q: An asset that is book-depreciated over a 5-year period by the straight line method has B3 = $62,000…
A: Given Book value at the end of 3 years B3=$62000 Depreciation charge per year (D)=$26000…
Q: A firm produces output with the production function, Q = F(K, L) = K0.5L0.5 with r=4 and w= 2. The…
A: Cost minimization problem of producer: For the given output level the firm and per unit cost of…
Q: Mauro Products distributes a single product, a woven basket whose selling price is $23 per unit and…
A: The break-even point in economics, business and specifically cost accounting is the point at which…
Q: A small scale mining investment is expected to generate $40,000 per year in profits over the next 12…
A: Formula for the future value of an annuity is given as: F = A{(1+R)n -1}RF: Future value of the…
Q: A natural monopoly derives barriers to entry from: Sole ownership of a natural resource Patent laws…
A: Monopoly is defined as a market structure with a single seller in the market with no competition.…
Q: the market for inputs to the production is also known as the ______ market a. production b.…
A: In economics the factor of production are used to produced goods and services.
Q: please do not copy and paste from internet, thanks
A: Seigniorage is a phrase used to describe the revenue the government obtains from issuing new money.
Q: You finish your engineering degree with $17,350 in student loans. The interest rate on your loans…
A: Since you have asked multiple questions, we are answering only the first question for you. To get…
Q: When the price of gasoline increases by 10 percent the quantity demanded falls by 2 percent. What is…
A: Note: In the question, it should be price elasticity of gasoline, not milk, since the information…
Q: What is explicit cost in business. Kindly explain it properly
A: Explicit costs are regular corporate expenses that can be physically accounted for and are…
Q: Include correctly labeled diagrams, if useful or required, in explaining your answers. A correctly…
A: An indirect cost or benefit that is experienced by a third party as a result of the acts of another…
Q: Traditional economic analysis explains why people are predictably irrational irrationally…
A: The Traditional Economic approach or analysis is based on the belief that in an ideal economic…
Q: One argument often heard against using fiscal policy to tame the business cycle is that the lags…
A: A fiscal policy is one in which the government use taxes, spending, and borrowing as instruments to…
Q: The following graph shows the loanable funds market in the United States. It plots both the demand…
A: A budget surplus happens when income more than expenditures. The term often refers to a government's…
Q: Include correctly labeled diagrams, if useful or required, in explaining your answers. A correctly…
A: A monopoly refers to a type of market condition in which there is only one single seller that sells…
Q: O Sell S&P 500 futures O Buy S&P 500 futures O Sell interest rate futures Buy interest rate futures…
A: futures contract refers to the standardized legal contract to purchase or sell something at a…
Q: A production possibilities curve that is concave to the origin (bowed out) implies that as more of a…
A: The production possibilities curve (PPC) is a graph that describes all of the different combinations…
Q: 49. A monopolist faces market demand given by P = 120-Q. For this market, MR = 120-2Q and MC = 4Q.…
A: Producer surplus is the difference between the amount that a producer is wiiling to take and the…
Q: Answer following as indic (Format: problem, then, solution 1. Brian borrowed from his friend, Mark,…
A: The cost of borrowing money is referred to as simple interest, and it does not take into account the…
Q: In an economy, the demand for deposits is 150,000 goods and the non-borrowed part of the monetary…
A: Reserve requirement refers to the minimum of total demand deposits a bank has to keep within itself.…
Q: A new barcode reading device has an installed cost basis of $24,160 and an estimated service life of…
A: The Depreciation is simply fall in the value of assets. There are various methods to calculate…
Q: D Question 16 Suppose the following: • Smokey Bank has total deposits of $600,000. . In addition, it…
A: The formula for money multiplier is 1 divided by the required reserve ratio as we know the required…
Q: Refer to Table 15-4. Suppose the following table illustrates the values of real and potential GDP…
A: Given information Values of real GDP in 2022 is $18.1 trillion Values of potential real GDP in 2022…
Q: 2. The market for plasticans is perfectly competitive. Market Supply is given by Q=2P and Market…
A: Perfectly competitive markets are known for a huge number of traders and consumers in the market.…
Q: Refer to Table 12-4. Given the data in the table above, the marginal propensity to save is A) 0.3. B…
A: Marginal propensity to consume is the term used to describe the rise in consumption that results…


Trending now
This is a popular solution!

Step by step
Solved in 3 steps with 2 images


- The following graph represents the demand and supply for an imaginary good called a pinckney. The black point (plus symbol) indicates the pre-tax equilibrium. Suppose the government has just decided to impose a tax on this market; the grey points (star symbol) indicate the after-tax scenario. Complete the following table, given the information presented on the graph. Result Value Per-unit tax Price producers receive before tax Equilibrium quantity after tax In the following table, indicate which of the previous graph’s areas corresponds to each concept. Check all that apply. Concept A B C D E F Producer surplus after the tax is imposed Tax revenue after the tax is imposed Consumer surplus after the tax is imposedConsider the following market. Demand is given by Qd= 5- P where Qd is the quantity demand and P is the price. Supply is given by Qs = P/2 where Qs is the quantity supplied. a. What is the market equilibrium quantity and price? b Calculate consumer, producer and total surplus c. Suppose the government imposes a price floor of P = 4. Calculate the consumer surplus, producer surplus, and deadweight loss.Suppose that the government has been supporting the price of corn. Its free market price is $2.50 per bushel, but the government has been setting a support price of $3.50 per bushel. Which of the following are ways that the government might try to reduce the size of the corn surplus? (Select one or more answers from the choices shown.) a. Decrease the support price. b. Institute an acreage allotment program. c. Decrease demand by taxing purchases of corn. d. Raise the support price.
- Consider the market depicted in the graph and assume the government imposes a price ceiling of P3. Note that the regulated price may not be the price that prevails in the market because of the Enforcement Problem and the Cycle of Resistance and Regulation. Which answers are correct? multiple choices can be correct.Refer to Figure 4. If the government imposed a corrective tax that successfully moved the market from the market equilibrium to the social optimum, then tax revenue for the government would amount toHow will the imposition of the chosen government policy impact consumer surplus, producer surplus and total surplus in this scenario
- Consider a market where demand and supply satisfy the following equations Q D = 12 – 2 P, QS = 2P. 1.Find the current equilibrium price and quantity. 2.What is the total producer surplus if the market is in equilibrium? The government is considering a minimum price policy to increase producer surplus. 3.Explain by means of graphs how the introduction of a price floor can increase producer surplus. 4.Find the (optimal) price floor that maximizes producer surplus.The market rental price today is high and therefore governed plans to introduce rent controls in the form of a rental price ceiling. Explain with the help of a well-labelled economic diagram how a rental price cap works and its intended objective as well as generating an unintended policy consequence. show the shortage and decrease in supply on the diagramUse the accompanying graph to answer these questions. a. Suppose demand is D and supply is S0. If a price ceiling of $6 is imposed, what are the resulting shortage and full economic price? b. Suppose demand is D and supply is S0. If a price support of $12 is imposed, what is the resulting surplus? What is the cost to the government of purchasing any and all unsold units? c. Suppose demand is D and supply is S0 so that the equilibrium price is $10. If an excise tax of $6 is imposed on this product, what happens to the equilibrium price paid by consumers? The price received by producers? The number of units sold? d. Calculate the level of consumer and producer surplus when demand and supply are given by D an respectively. e. Suppose demand is D and supply isb.
- Provide a real-world example of a binding price ceiling. Why might policy makers have introduced this binding price ceiling? Show, using a diagram (which is properly labelled) the effect of this binding price ceiling in the market. Note:- Do not provide handwritten solution. Maintain accuracy and quality in your answer. Take care of plagiarism. Answer completely. You will get up vote for sure.Suppose that the government imposes a tax on cigarettes, use the diagram below to answer the questions. D is the demand curve before tax, S is the supply curve before tax and ST is the supply curve after the tax. For the market without the tax. Indicate (I)price paid by consumers (Ii) price paid by producers (iii) quantity of cigarettes sold (iv) buyer's reservation price (v) sellers reservation price (b) Calculate the consumer surplus before the tax. (c) calculate the producer surplus before the tax. (d) For the market for cigarettes with the tax, calculate (I) the tax (ii) price paid by consumers (iii) price recieved by producers (iv) quantity of cigarettes sold (e) (I) Calculate the consumer surplus after the tax. (ii) calculate the producer surplus after the tax. (iii) the tax revenue (iv) deadweight loss (v) total surplus after taxRefer to Figure 6-7. Which of the following statements is not correct? a. A government-imposed price of $10 would be a binding price floor if market demand is Demand A and a nonbinding price ceiling if market demand is Demand B. b. A government-imposed price of $4 would be a binding price ceiling if market demand is either Demand A or Demand B. c. A government-imposed price of $10 would be a binding price ceiling if market demand is either Demand A or Demand B. d. A government-imposed price of $8 would be a binding price floor if market demand is Demand A and a binding price ceiling if market demand is Demand B