A group of students was doing a research work about the proportion of smokers among the employees of a certain manufacturing plant. A random sample of 500 employees showed that 150 of them smoke. a. If we want to test Ho: p = 0.25 against H₁ :p 0.25, then the test (Round off your answer to 3 statistics is equal to decimal places b. If we want to test Ho: p = 0.25 against H₁ p = 0.25, at a level of significance of 0.10, the acceptance region is (Select your answer from the choices below - write, either 1, 2, 3 or4)
Q: Based on historical data in Oxnard college, we believe that 30% of freshmen do not visit their…
A: It is given that margin of error (E) is 0.01 and the confidence level is 99%.
Q: A student organization at a local college posted a poll on its Web site. After a semester, the…
A: A sample made up of people who freely decided to take part as a member of the sample group is termed…
Q: The population of weights of a particular fruit is normally distributed, with a mean of 727 grams…
A: given data normal distributionμ = 727σ = 22n = 19for top 16% find mean.
Q: Suppose the age that children learn to walk is normally distributed with mean 12 months and standard…
A: GivenMean(μ)=12standard deviation(σ)=1.3sample size(n)=15
Q: Suppose IQ scores were obtained for 20 randomly selected sets of siblings. The 20 pairs of…
A: given data regression equation : y^ = 6.25+0.96xp value = 0.000r = 0.867n = 20y¯ = 103.5x¯ =…
Q: Suppose that 44% of US adults favor more government spending for Covid-19 relief. What is the…
A: given data P(favor more spending) = p = 0.44 sample size (n) = 15 x = no. of people favor more…
Q: Let X represent the full height of a certain species of tree. Assume that X has a normal probability…
A: From the provided information, Mean (µ) = 248.8 Standard deviation (σ) = 5.1 Sample size (n) = 241
Q: The circumference of a particular species of tree was thought to be different depending on certain…
A: Construct the 95% confidence interval for the difference between the population means when…
Q: Treatment 1 0 0 0 3 0 0 T=3 SS= 7.5 Treatment 2 2 3 1 3 2 1 T = 12 SS=4 Treatment 3 4 2 4 3 4 4 G=36…
A: a) Create an ANOVA table Data > Data analysis > ANOVA: single factor > select input range…
Q: Ten rats were randomly assigned a solid diet and 10 in a liquid diet. At the end of the feeding…
A: Given regression line For Liquid y =110-0.75x For Solid y = 84 + 3.66x
Q: unemployed is 14.7 weeks. Assume that for the population of all unemployed individuals the…
A: Let X be the random variable from normal distribution with mean (μ) = 14.7, standard deviation (σ) =…
Q: The distribution of scores on a standardized aptitude test is approximately normal with a mean of…
A: Given mean is 510 and standard deviation is 95.
Q: The sampling constant, Ks, can be used to determine the sample mass needed to reduce the sampling…
A: The mass obtained for sampling distribution is 1.67 g, and the relative standard deviation value R…
Q: A regression analysis resulted in the following information regarding a dependent variable (v) and…
A:
Q: 17. Calculate the correlation between the IQ of a person with the number of hours spent in the class…
A:
Q: An automotive engineer wants to estimate the cost of repairing a car that experiences a 25 MPH…
A:
Q: A factory has a machine that dispenses 90 ml of fluid in a bottle. An employee believes the average…
A: From the provided information, Sample size (n) = 50 Sample mean (x̄) = 81 Sample standard deviation…
Q: The best predicted value of y for an adult male who is 180 cm tall is (Round to two decimal places…
A:
Q: 3. The following data are from an independent-measures experiment comparing two treatment…
A: Given the data from an independent-measures experiment comparing two treatment conditions :…
Q: If a research study found that there was a significant correlation between two variables based on a…
A: Correlation is used to measure the association between the two variables. There are three types of…
Q: Assume that adults have IQ scores that are normally distributed with a mean of 99 and a standard…
A: given data normal distributionμ = 99σ = 18.3P(x>134.6) = ?
Q: You want to calculate the probability of getting a value that is less than 1 standard devation below…
A: Given that The data has a bell shape and is symmetric about the population mean which equals 0.…
Q: A book claims that more hockey players are born in January through March than in October through…
A: Null hypothesis: H0: The distribution of hockey players' birth months is uniformly distributed…
Q: A manufacturer knows that their items have a normally distributed lifespan, with a mean of 4.1…
A:
Q: Obtain the studentized deleted residuals. Which case has the largest absolute value studentized…
A: The formula for studentized deleted residuals is ti=dis(di)=eiMSEi1-hii
Q: The following side-by-side box plots show the prices (in thousands) of 48 houses in Corvallis, OR.…
A: Solution: Given information: k=4 Categories Each category has 12 observation.
Q: Exhibit 11-5 The table below gives beverage preferences for random samples of teens and adults.…
A: The data shows the beverage preferences for random sample of teens and adults.
Q: An auto dealer would like to determine if there is a difference in the braking distance (the number…
A: Suppose μd is the difference of the mean barking distance of the two models.
Q: You want to find the probability of getting a z score less than or equal to 1.2. Which distribution…
A: The best distribution for calculating this probablity is "normal distribution". We need to look for…
Q: Find the Cramer-Rao lower bound (CRLB) for the variance of any unbiased estimator
A:
Q: MARS cams that Semes candes should be comprised of 30% purple 10% o 285 green and 200 orange candles…
A: Given Information: Claim: Skittle candles should be comprised of 30% purple, 10% orange, and 20%…
Q: The table below lists weights (carats) and prices (dollars) of randomly selected diamonds. Find the…
A: Given information: Weight (X) Price (Y) 0.3 525 0.4 1164 0.5 1349 0.5 1417 1 5666 0.7…
Q: The daily yield for a local chemical plant has averaged 880 tons for the last several years. The…
A:
Q: Annie and Alvie have agreed to meet between 5:00 p.m. and 6:00 p.m. for dinner at a local…
A: Given that: X= Annie's arrival time Y= Alvie's arrival time X and Y are uniformly distributed on the…
Q: X is a normal random variable with mean 5.0 and standard deviation 1.25. Find P (X> 6.26). (Round to…
A: Given mean is 5.0 and standard deviation is 1.25.
Q: where are these numbers coming from?
A: From the given information, the sample size n is 10 and the odds of winning each ticket in the…
Q: The amount of coffee that people drink per day is normally distributed with a mean of 17 ounces and…
A:
Q: Lorretha Princess Members In this assignment you will work to use Stat Crunch to find…
A: Since you have asked multiple questions, we will solve the first question for you. If you want any…
Q: am interested if there is a difference in the mean amount that freshman and seniors spend on texts…
A: Given that random sample of 54 freshman and 52 seniors. Based on these samples a 95% confidence…
Q: Two groups of physical therapy patients are subjected to two different treatment regimens. At the…
A: Given information: Group 1 Group 2 90.3 88.8 92.8 82.4 91.9 89.1 81.4 90.3 86.5 88.2…
Q: The sampling distribution of a statistic is O the probability that we obtain the statistic in…
A: The sampling distribution of a statistic is "the probablity that we obtain the statistic in repeates…
Q: The data show the chest size and weight of several bears. Find the regression equation, letting…
A: Obtain the regression equation. The regression equation is obtained below as follows: From the…
Q: The table below lists measured amounts of redshift and the distances (billions of light-years) to…
A: From the given information we have Now degree of freedom (df) = n -1 = 6 -2= 4Critical value at α…
Q: A life insurance company wishes to examine the relationship between the amount of life insurance…
A: Since you have posted a question with multiple subparts, we will solve first three subparts for you.…
Q: Find the area of the shaded region under the standard normal distribution to the left of the given…
A: Givenshaded region is
Q: The average salary in this city is $41,900. Is the average different for single people? 59 randomly…
A:
Q: On a recent quiz, the class mean was 71 with a standard deviation of 3.6. Calculate the standardized…
A: According to the given information, we have Mean = 71 Standard deviation = 3.6
Q: 3. MMW The mean grade of students in MMW is 84.7 and the standard deviation is 1.69. (a) Determine…
A:
Q: Test the claim that the proportion of people who own cats is larger than 70% at the 0.10…
A: From the provided information, Sample size (n) = 200 From which 74% owned cats that is p̂ = 0.74…
Q: You are doing a research project for a class you are taking. You want to show the value such that…
A: We will be first finding the descriptive statistics and then calculate the five number summary of…
UPVOTE WILL BE GIVEN. NO EXPLANATION NEEDED. YOU MAY USE EXCEL. PLEASE ANSWER ALL QUESTIONS.
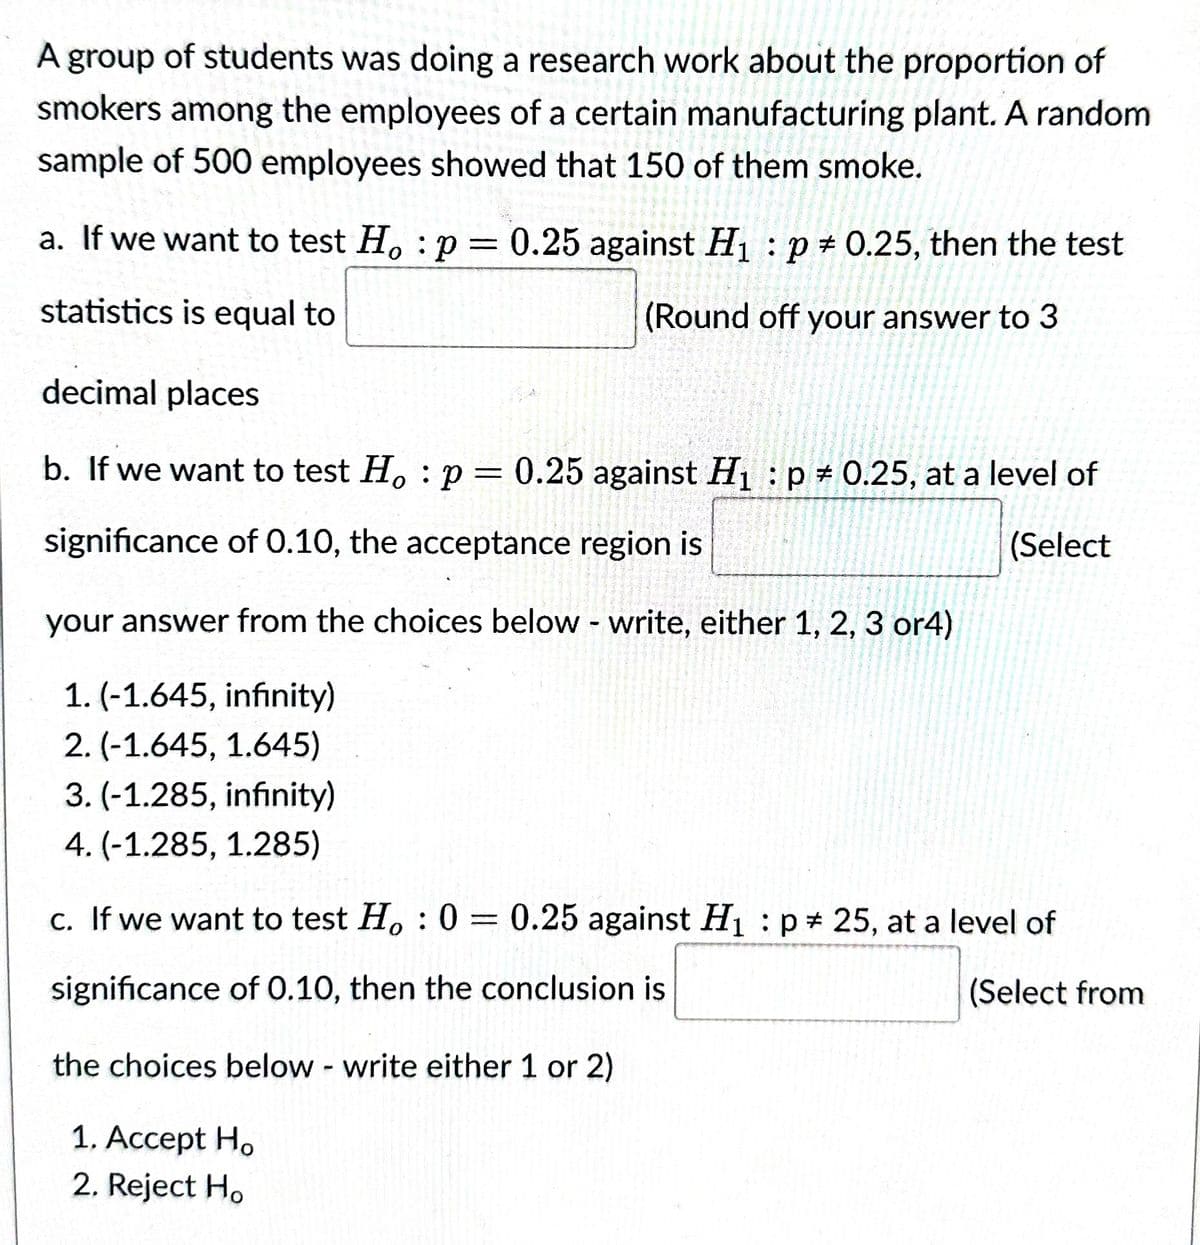
Step by step
Solved in 2 steps with 1 images
- Which of the following can cause OLS estimators to be biased?(i) Heteroskedasticity.(ii) Omitting an important variable.(iii) A sample correlation coefficient of .95 between two independent variables both included in the model.The NAEP considers that a national average of 283 is an acceptable performance. Using α = .05, run a two-tail t-test for one sample to test Ho: µ=283 for the 2019 scores. Report the t-obt, df, and p-values. Would you reject the null hypothesis that the 2019 scores come from a population with average 283? If this is the case, does it come from a population from larger or smaller average?Question 17: A well-known brokerage firm executive claimed that 90% of investors are currently confident of meeting their investment goals. An XYZ Investor Optimism Survey, conducted over a two week period, found that in a sample of 100 people, 81% of them said they are confident of meeting their goals.Test the claim that the proportion of people who are confident is smaller than 90% at the 0.05 significance level.The null and alternative hypothesis would be: H0:p≤0.9H0:p≤0.9H1:p>0.9H1:p>0.9 H0:μ≤0.9H0:μ≤0.9H1:μ>0.9H1:μ>0.9 H0:μ≥0.9H0:μ≥0.9H1:μ<0.9H1:μ<0.9 H0:μ=0.9H0:μ=0.9H1:μ≠0.9H1:μ≠0.9 H0:p=0.9H0:p=0.9H1:p≠0.9H1:p≠0.9 H0:p≥0.9H0:p≥0.9H1:p<0.9H1:p<0.9 The test is: two-tailed right-tailed left-tailed The test statistic is: (to 3 decimals)The p-value is: (to 4 decimals)Based on this we: Fail to reject the null hypothesis Reject the null hypothesis
- Do types of crimes reported on television newscasts differ by the age of the criminals? A researcher uses her dvr to record the local television news for a 2-week period of time. She records the types of crimes and notes the age of the offender. Conduct a chi-square test (alpha = .05) of the null hypothesis that televised offense type does not vary by age group of offender. Offense type Young middle age older violent 27 10 3 property 14 12 11 sex 7 9 5 Report the obtained chi-square, df, and critical chi-square. Report your findings based on the null hypothesis.If the value of Cronbach’s alpha is 0.07, it means ___________; a. Research instrument is not reliable b. Research instrument is internally consistent c. Data is reliable d. Data is internally consistentQuestion 9 A well-known brokerage firm executive claimed that 60% of investors are currently confident of meeting their investment goals. An XYZ Investor Optimism Survey, conducted over a two week period, found that in a sample of 100 people, 61% of them said they are confident of meeting their goals.Test the claim that the proportion of people who are confident is larger than 60% at the 0.10 significance level.The null and alternative hypothesis would be: H0:μ≤0.6H0:μ≤0.6H1:μ>0.6H1:μ>0.6 H0:p≥0.6H0:p≥0.6H1:p<0.6H1:p<0.6 H0:p≤0.6H0:p≤0.6H1:p>0.6H1:p>0.6 H0:μ≥0.6H0:μ≥0.6H1:μ<0.6H1:μ<0.6 H0:μ=0.6H0:μ=0.6H1:μ≠0.6H1:μ≠0.6 H0:p=0.6H0:p=0.6H1:p≠0.6H1:p≠0.6 The test is: left-tailed right-tailed two-tailed The test statistic is: (to 2 decimals)The p-value is: (to 4 decimals)Based on this we: Fail to reject the null hypothesis Reject the null hypothesis
- Consider the following: In general, when people diet they typically lose 10 lbs. (?σ = 2). A random sample of 16 people on the keto diet lost 15 lbs. Do people on the keto diet lose more or less weight than people on diets in general? 3. What is the Null Hypothesis? a)On average, weight loss in the keto diet sample does not differ from weight loss in the population of dieters in general. (H0: X-bar = Mu)) b)On average, weight loss in the keto diet sample does not differ from weight loss in the population of dieters in general. (H0: X-bar does not equal Mu) c)On average, weight loss in the keto diet sample differs from weight loss in the population of dieters in general. (H0: X-bar does not equal Mu) d)On average, weight loss in the keto diet sample differs from weight loss in the population of dieters in general. (H0: X-bar = Mu)A large manufacturing company investigated the service it received from its suppliers and discovered that, in the past, 38% of all material shipments were received late. However, the company recently installed a just-in-time system in which suppliers are linked more closely to the manufacturing process. A random sample of 150 deliveries since the just-in-time system was installed reveals that 33 deliveries were late. If we want to test whether the proportion of late deliveries was reduced signicantly at = 0:10 the null and alternative hypotheses are a. Null hypothesis (H0) b. Alternative hypothesis (HA)