A hospital was concerned about reducing its wait time. A targeted wait time goal of 25 minutes was set. After implementing an improvement framework and process, a sample of 360 patients showed the mean wait time was 23 22 minutes, with a standard deviation of 16.36 minutes. Complete parts (a) and (b) below a. If you test the null hypothesis at the 0.10 level of significance, is there evidence that the population mean wait time is less than 25 minutes? State the null and alternative hypotheses, OA. H₂ #25 H₁ 225 OD. H₂ #<25 H₂ > 25 OB. H₂ μ<25 H₁ a 25 OE. H 225 H₂ <25 Find the test statistic for this hypothesis test test statistic Find the p-value The p-value is (Type an integer or a decimal. Round to three decimal places as needed) (Type an integer or a decimal Round to two decimal places as needed.) OC. H 225 H₁ #25 OF H₂>25 H₂ <25
A hospital was concerned about reducing its wait time. A targeted wait time goal of 25 minutes was set. After implementing an improvement framework and process, a sample of 360 patients showed the mean wait time was 23 22 minutes, with a standard deviation of 16.36 minutes. Complete parts (a) and (b) below a. If you test the null hypothesis at the 0.10 level of significance, is there evidence that the population mean wait time is less than 25 minutes? State the null and alternative hypotheses, OA. H₂ #25 H₁ 225 OD. H₂ #<25 H₂ > 25 OB. H₂ μ<25 H₁ a 25 OE. H 225 H₂ <25 Find the test statistic for this hypothesis test test statistic Find the p-value The p-value is (Type an integer or a decimal. Round to three decimal places as needed) (Type an integer or a decimal Round to two decimal places as needed.) OC. H 225 H₁ #25 OF H₂>25 H₂ <25

MATLAB: An Introduction with Applications
6th Edition
ISBN:9781119256830
Author:Amos Gilat
Publisher:Amos Gilat
Chapter1: Starting With Matlab
Section: Chapter Questions
Problem 1P

Related questions
Question
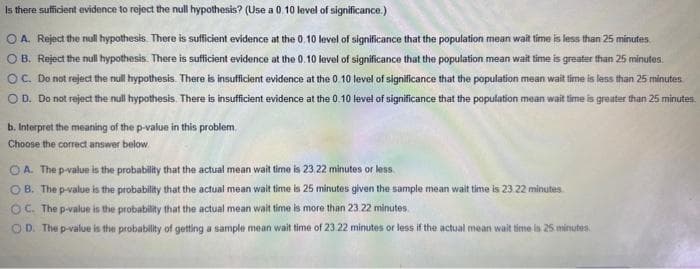
Transcribed Image Text:Is there sufficient evidence to reject the null hypothesis? (Use a 0.10 level of significance.)
OA. Reject the null hypothesis. There is sufficient evidence at the 0.10 level of significance that the population mean wait time is less than 25 minutes.
OB. Reject the null hypothesis. There is sufficient evidence at the 0.10 level of significance that the population mean wait time is greater than 25 minutes.
OC. Do not reject the null hypothesis. There is insufficient evidence at the 0.10 level of significance that the population mean wait time is less than 25 minutes
O D. Do not reject the null hypothesis. There is insufficient evidence at the 0.10 level of significance that the population mean wait time is greater than 25 minutes.
b. Interpret the meaning of the p-value in this problem.
Choose the correct answer below
OA. The p-value is the probability that the actual mean wait time is 23.22 minutes or less
OB. The p-value is the probability that the actual mean wait time is 25 minutes given the sample mean wait time is 23 22 minutes
OC. The p-value is the probability that the actual mean wait time is more than 23.22 minutes.
OD. The p-value is the probability of getting a sample mean wait time of 23.22 minutes or less if the actual mean wait time is 25 minutes.
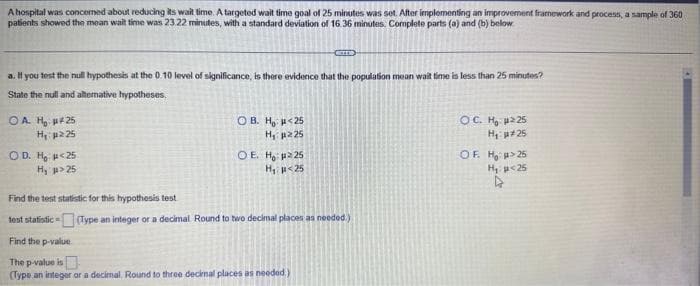
Transcribed Image Text:A hospital was concerned about reducing its wait time. A targeted wait time goal of 25 minutes was set. After implementing an improvement framework and process, a sample of 360
patients showed the mean wait time was 23.22 minutes, with a standard deviation of 16.36 minutes. Complete parts (a) and (b) below
a. If you test the null hypothesis at the 0.10 level of significance, is there evidence that the population mean wait time is less than 25 minutes?
State the null and alternative hypotheses.
OA. H₂ ##25
H₁ 225
OD. H₂ #<25
H₂ p> 25
Find the test statistic for this hypothesis test
test statistic
OB. H
H₁
OE. H
<25
225
225
H₂ <25
CODE
(Type an integer or a decimal Round to two decimal places as needed.)
Find the p-value
The p-value is
(Type an integer or a decimal. Round to three decimal places as needed.)
OC. Hg µ²25
H₁: #25
OF. H₂ µ> 25
H₂: <25
4
Expert Solution
This question has been solved!
Explore an expertly crafted, step-by-step solution for a thorough understanding of key concepts.

This is a popular solution!

Trending now
This is a popular solution!

Step by step
Solved in 2 steps with 1 images

Recommended textbooks for you
MATLAB: An Introduction with Applications
Statistics
ISBN:
9781119256830
Author:
Amos Gilat
Publisher:
John Wiley & Sons Inc

Probability and Statistics for Engineering and th…
Statistics
ISBN:
9781305251809
Author:
Jay L. Devore
Publisher:
Cengage Learning

Statistics for The Behavioral Sciences (MindTap C…
Statistics
ISBN:
9781305504912
Author:
Frederick J Gravetter, Larry B. Wallnau
Publisher:
Cengage Learning
MATLAB: An Introduction with Applications
Statistics
ISBN:
9781119256830
Author:
Amos Gilat
Publisher:
John Wiley & Sons Inc
Probability and Statistics for Engineering and th…
Statistics
ISBN:
9781305251809
Author:
Jay L. Devore
Publisher:
Cengage Learning
Statistics for The Behavioral Sciences (MindTap C…
Statistics
ISBN:
9781305504912
Author:
Frederick J Gravetter, Larry B. Wallnau
Publisher:
Cengage Learning

Elementary Statistics: Picturing the World (7th E…
Statistics
ISBN:
9780134683416
Author:
Ron Larson, Betsy Farber
Publisher:
PEARSON

The Basic Practice of Statistics
Statistics
ISBN:
9781319042578
Author:
David S. Moore, William I. Notz, Michael A. Fligner
Publisher:
W. H. Freeman

Introduction to the Practice of Statistics
Statistics
ISBN:
9781319013387
Author:
David S. Moore, George P. McCabe, Bruce A. Craig
Publisher:
W. H. Freeman