(a) In the calculation of which of the following summary statistics, all the data in the data set are used? (you may choose one or more than one answer) I: Range, II: Interquartile range, III: Standard deviation.
(a) In the calculation of which of the following summary statistics, all the data in the data set are used? (you may choose one or more than one answer) I: Range, II: Interquartile range, III: Standard deviation.

Glencoe Algebra 1, Student Edition, 9780079039897, 0079039898, 2018
18th Edition
ISBN:9780079039897
Author:Carter
Publisher:Carter
Chapter10: Statistics
Section10.4: Distributions Of Data
Problem 19PFA

Related questions
Question
Transcribed Image Text:Question 6
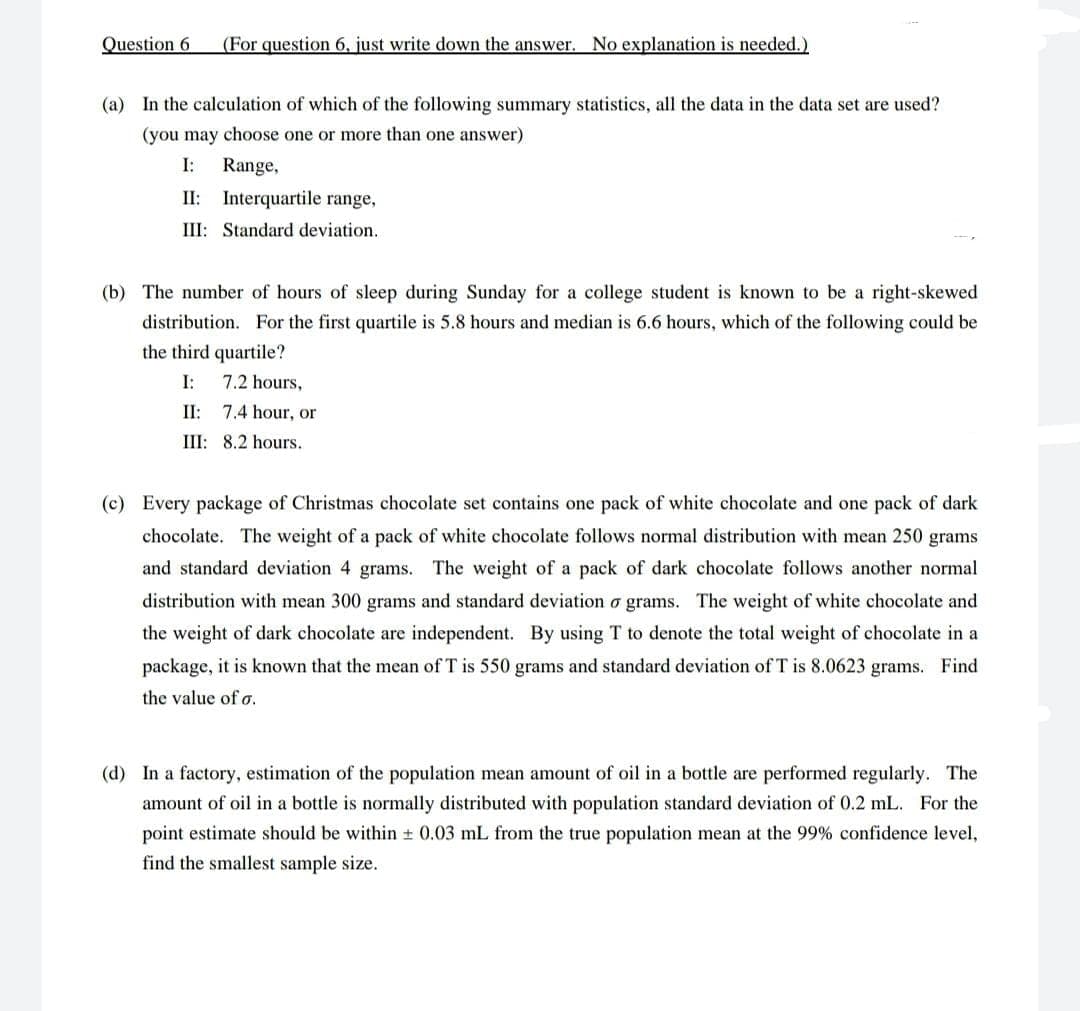
(For question 6, just write down the answer. No explanation is needed.)
(a) In the calculation of which of the following summary statistics, all the data in the data set are used?
(you may choose one or more than one answer)
I:
Range,
II: Interquartile range,
III: Standard deviation.
(b) The number of hours of sleep during Sunday for a college student is known to be a right-skewed
distribution. For the first quartile is 5.8 hours and median is 6.6 hours, which of the following could be
the third quartile?
I:
7.2 hours,
II: 7.4 hour, or
III: 8.2 hours.
(c) Every package of Christmas chocolate set contains one pack of white chocolate and one pack of dark
chocolate. The weight of a pack of white chocolate follows normal distribution with mean 250 grams
and standard deviation 4 grams. The weight of a pack of dark chocolate follows another normal
distribution with mean 300 grams and standard deviation o grams. The weight of white chocolate and
the weight of dark chocolate are independent. By using T to denote the total weight of chocolate in a
package, it is known that the mean of T is 550 grams and standard deviation of T is 8.0623 grams. Find
the value of o.
(d) In a factory, estimation of the population mean amount of oil in a bottle are performed regularly. The
amount of oil in a bottle is normally distributed with population standard deviation of 0.2 mL. For the
point estimate should be within + 0.03 mL from the true population mean at the 99% confidence level,
find the smallest sample size.
Expert Solution
This question has been solved!
Explore an expertly crafted, step-by-step solution for a thorough understanding of key concepts.

Step by step
Solved in 2 steps

Recommended textbooks for you
Glencoe Algebra 1, Student Edition, 9780079039897…
Algebra
ISBN:
9780079039897
Author:
Carter
Publisher:
McGraw Hill
Glencoe Algebra 1, Student Edition, 9780079039897…
Algebra
ISBN:
9780079039897
Author:
Carter
Publisher:
McGraw Hill