A large family-held department store had the business objective of improving its response to complaints. The va between when the complaint was made and when it was resolved. Data were collected from 40 complaints that w (a) through (d) below. A Click the icon to view the data table. .....
A large family-held department store had the business objective of improving its response to complaints. The va between when the complaint was made and when it was resolved. Data were collected from 40 complaints that w (a) through (d) below. A Click the icon to view the data table. .....

Glencoe Algebra 1, Student Edition, 9780079039897, 0079039898, 2018
18th Edition
ISBN:9780079039897
Author:Carter
Publisher:Carter
Chapter4: Equations Of Linear Functions
Section: Chapter Questions
Problem 8SGR

Related questions
Question
i need the answer quickly
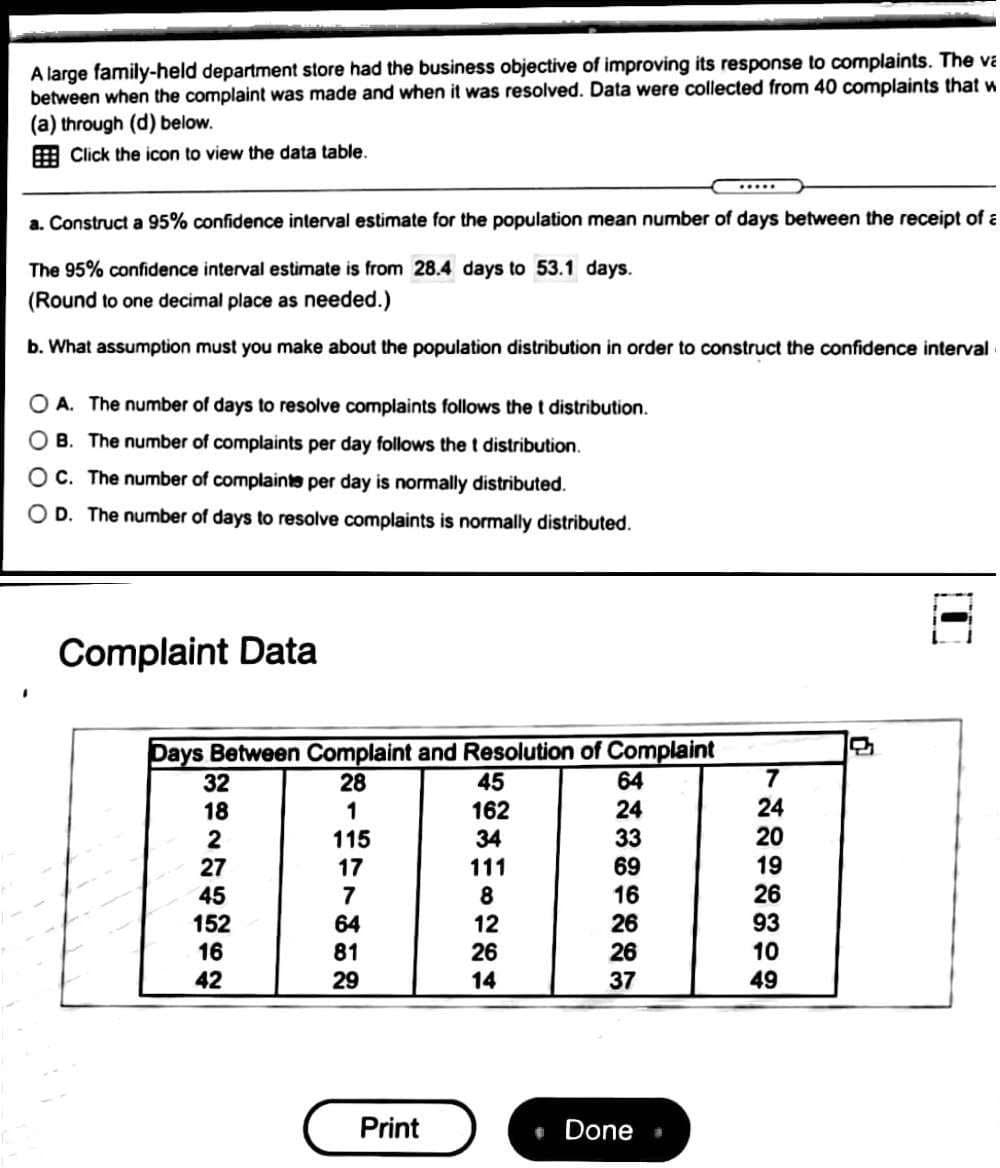
Transcribed Image Text:A large family-held department store had the business objective of improving its response to complaints. The va
between when the complaint was made and when it was resolved. Data were collected from 40 complaints that w
(a) through (d) below.
E Click the icon to view the data table.
.....
a. Construct a 95% confidence interval estimate for the population mean number of days between the receipt of a
The 95% confidence interval estimate is from 28.4 days to 53.1 days.
(Round to one decimal place as needed.)
b. What assumption must you make about the population distribution in order to construct the confidence interval
O A. The number of days to resolve complaints follows the t distribution.
O B. The number of complaints per day follows the t distribution.
O C. The number of complainte per day is normally distributed.
O D. The number of days to resolve complaints is normally distributed.
Complaint Data
Days Between Complaint and Resolution of Complaint
45
32
28
64
7
24
162
34
24
33
18
20
2
27
45
152
16
42
115
69
16
26
19
26
17
111
7
8
12
64
93
26
10
49
81
26
29
14
37
Print
Done
* --
Expert Solution
This question has been solved!
Explore an expertly crafted, step-by-step solution for a thorough understanding of key concepts.

This is a popular solution!

Trending now
This is a popular solution!

Step by step
Solved in 3 steps with 2 images

Recommended textbooks for you
Glencoe Algebra 1, Student Edition, 9780079039897…
Algebra
ISBN:
9780079039897
Author:
Carter
Publisher:
McGraw Hill

College Algebra (MindTap Course List)
Algebra
ISBN:
9781305652231
Author:
R. David Gustafson, Jeff Hughes
Publisher:
Cengage Learning
Glencoe Algebra 1, Student Edition, 9780079039897…
Algebra
ISBN:
9780079039897
Author:
Carter
Publisher:
McGraw Hill
College Algebra (MindTap Course List)
Algebra
ISBN:
9781305652231
Author:
R. David Gustafson, Jeff Hughes
Publisher:
Cengage Learning