A large firm employing tens of thousands of workers has been accused of discriminating against its female managers. The accusation is based on a random sample of 100 managers. The mean salary for 38 female managers is $76,189, while the mean annual salary of 62 male managers is $97,832. A two-sample t-test reveals that the difference between the male and female mean salaries is significant yielding a p-value less than 0.01, suggesting there is overwhelming evidence that the mean male salary is significantly higher than the mean female salary. The president of the company points out that the company has a strict policy of equal pay for equal work and that the difference in pay must be attributable to some other factors besides gender. To this point he provides the following multiple linear regression output where: Education is recorded as the number of years of education each manager had Experience is recorded as the number of years of experience Gender is recorded as 0 for female, 1 for male 1. The coefficient for gender is $1851 suggesting that males make on average about $1,851 more than females, but a previous two-sample t-test analysis clearly indicated a significant difference of about ($97,832 - $76,189) = $21,643. Explain how these two analyses came to such different findings. 2. The adjusted R2 = 0.6836. Interpret this value in terms of the data analyzed and the model produced. Does this suggest that the model is a reasonable model to use? (“All models are wrong but some are useful.”) 3. What do you conclude about the accusation that the company is discriminating against its female managers?


A large firm employing tens of thousands of workers has been accused of discriminating against its female managers. The accusation is based on a random sample of 100 managers. The mean salary for 38 female managers is $76,189, while the mean annual salary of 62 male managers is $97,832. A two-sample t-test reveals that the difference between the male and female mean salaries is significant yielding a p-value less than 0.01, suggesting there is overwhelming evidence that the mean male salary is significantly higher than the mean female salary.
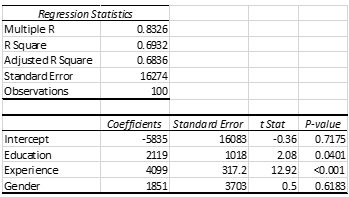
The president of the company points out that the company has a strict policy of equal pay for equal work and that the difference in pay must be attributable to some other factors besides gender. To this point he provides the following multiple linear regression output where:
Education is recorded as the number of years of education each manager had
Experience is recorded as the number of years of experience
Gender is recorded as 0 for female, 1 for male
1. The coefficient for gender is $1851 suggesting that males make on average about $1,851 more than females, but a previous two-sample t-test analysis clearly indicated a significant difference of about ($97,832 - $76,189) = $21,643. Explain how these two analyses came to such different findings.
2. The adjusted R2 = 0.6836. Interpret this value in terms of the data analyzed and the model produced. Does this suggest that the model is a reasonable model to use? (“All models are wrong but some are useful.”)
3. What do you conclude about the accusation that the company is discriminating against its female managers?


Trending now
This is a popular solution!

Step by step
Solved in 3 steps


