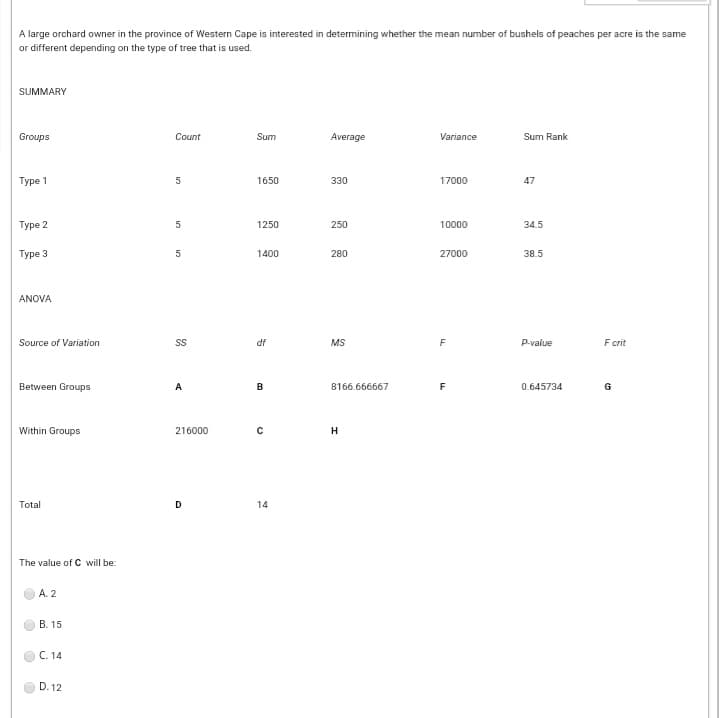
A large orchard owner in the province of Western Cape is interested in determining whether the mean number of bushels of peaches per acre is the same or different depending on the type of tree that is used. SUMMARY Groups Count Sum Average Variance Sum Rank Туре 1 1650 330 17000 47 Туре 2 1250 250 10000 34.5 Туре 3 1400 280 27000 38.5 ANOVA Source of Variation df MS F P-value Fcrit Between Groups A B 8166.666667 0.645734 G Within Groups 216000 Total D. 14 The value of C will be: A. 2 В. 15 C. 14 D. 12


Q: A random sample of 12 employees in a large manufacturing plant found the following figures for…
A: Disclaimer, Since you have posted a question with multiple sub-parts, we will solve first three…
Q: Assume average grade of Physics 1 was 74 in fall 2019. We estimated the average grade of Physics 1…
A:
Q: Find B and C: Note: The data on the excel in the yellow box is wrong.
A: Given Null Hypothesis : H0 : µ1 = µ2Alternate Hypothesis : Ha : µ1 ≠ µ2 This is a two tail testUse…
Q: The Null Hypotheses is: H0: μ1 - μ2 = 0 Based on these hypotheses, find the following. Round…
A: The test statistic and P-value value is obtained by using EXCEL. The software procedure is given…
Q: 400 B.C. 131 138 125 129 132 135 132 134 138 1850 B.C. 129 134 136 137…
A: Note: Hey there! Thank you for posting the questions. However, you have posted 4 different questions…
Q: Is the variance for the amount shoppers spend on Saturdays at the mall the same as the variance for…
A: The sample variance for Saturday can be obtained using the excel formula “=VAR.S(A1:A13)”. From the…
Q: Following is the data related to the daily production of the two factories of same product located…
A: Given data related to the daily production of the two factories of same product located in two…
Q: A real estate agent believes that the mean home price in the northern part of a county is higher…
A: From the provided information, The claim is that the mean home price in the northern part of a…
Q: 400 B.C. 131 138 125 129 132 135 132 134 138 1850 B.C. 129 134 136 137 137 129 1136 138 134 150B…
A: Given Information : Data represents skull breadths obtained from skulls of Egyptian makes from three…
Q: To study the effect of temperature on yield in a chemical process, five batches were produced at…
A: Excel: Data --> Data analysis -->Anova: Single Factor
Q: Following is the data related to the daily production of the two factories of same product located…
A: Since you have posted a question with multiple sub-parts, we will solve first three sub-parts for…
Q: A large is interested in determining whether the mean number of bushels of peaches per the same or…
A: We have given that Total number of observation=n=15 Number of treatment=k=3
Q: Group_size_(24/24F) 91 90 79 100 146 85 110 173 125 120 180 140 124 278…
A: Assume the samples are random and independent, the populations are normally distributed, and the…
Q: A study is being carried out to see any differences in life satisfaction between young, middle-…
A: If P-value is less than level of significance then reject the null hypothesis. Otherwise fail to…
Q: A researcher takes sample temperatures in Fahrenheit of 19 days from New Orleans (Group 1) and 19…
A: Note: We have used the excel data analysis tool to run the t-test.
Q: THE NEXT QUESTIONS ARE BASED ON THE FOLLOWING INFORMATION: An analysis of variance table is…
A: Given Information: An analysis of variance table is displayed below with missing values: (a) The…
Q: The promoter of a touring dance show wishes to analyse how the price per ticket affects the size of…
A: The promoter of a touring dance show wishes to analyse how the price per ticket affects the size of…
Q: The Braking Distance of 8 Volkswagen GTIs and 10 Ford Focuses were tested when traveling at 60 miles…
A: Given that 1. State the alternative hypothesis. a. Ha : μ1 < μ2 b. Ha : μ1 >…
Q: Background: The butterfat content of random samples of Guernsey, Holstein and Jersey cows are…
A: The one-way analysis of variance (ANOVA) is an extension of independent two-sample t-test is used in…
Q: At α=0.05, is there enough evidence to conclude that at least one mean battery price is different…
A:
Q: To study the effect of temperature on yield in a chemical process, five batches were produced at…
A: I am using Excel and the command is as follows Data > Data analysis > Anova: single factor…
Q: To study the effect of temperature on yield in a chemical process, five batches were produced at…
A:
Q: A researcher takes sample temperatures in Fahrenheit of 15 days from Oklahoma City and 17 days from…
A:
Q: 400 B.C. 131 138 125 129 132 135 132 134 138 1850 B.C. 129 134 136 137 137 129 1136 138 134 150B…
A: 5. Type of test: There are 3 different epochs of skulls of Egyptian makes. Denote the true average…
Q: Following is the data related to the daily production of the two factories of same product located…
A: Since you have posted a question with multiple sub-parts, we will solve first three sub-parts for…
Q: 400 B.C. 131 138 125 129 132 135 132 134 138 1850 B.C. 129 134 136 137 137 129 1136 138 134 150B…
A: Solution: 4. State the hypotheses. Null hypothesis: H0: The mean skull breadths for the different…
Q: A study is being carried out to see any differences in life satisfaction between young, middle-…
A: The sum of squares due to gender, error and total are 6, 4, and 27.333, respectively.
Q: A researcher runs a program 20 times and measures the time (in seconds) it takes for the program to…
A:
Q: he two-way analysis of variance _________. Group of answer choices assesses the effects of two…
A: Option d) is correct. All of these
Q: 400 B.C. 131 138 125 129 132 135 132 134 138 1850 B.C. 129 134 136 137 137 129 1136 138 134 150B…
A: Solution: Note: Hello! As you have posted more than 3 sub parts, we are answering the first 3…
Q: To study the effect of temperature on yield in a chemical process, five batches were produced at…
A: Use EXCEL Procedure to obtain the table for ANOVA. Follow the instruction to obtain the values for…
Q: o study the effect of temperature on yield in a chemical process, five batches were produced at each…
A: I am using Excel and the command is as follows. Data >> Data analysis >> Anova : single…
Q: Following is the data related to the daily production of the two factories of same product located…
A: Since you have posted a question with multiple sub-parts, we will solve first three sub-parts for…
Q: According to a consumer spending survey, the average monthly of BharatBank Visa credit card charge…
A: Note: Please repost remaining subparts as i can answer only 3 subparts as per my policy. Given…
Q: A researcher takes sample temperatures in Fahrenheit of 18 days from Pittsburgh and 16 days from…
A: Given that, a researcher takes sample temperatures in Fahrenheit of 18 days from Pittsburgh and 16…
Q: Researchers looked at the average number of hours of sleep per day in a group of 8 college…
A:
Q: Following is the data related to the daily production of the two factories of same product located…
A:
Q: To study the effect of temperature on yield in a chemical process, five batches were produced at…
A: There are three temperature levels. Those are independent and follow normal distribution. We have to…
Q: Group Mean Variance df n 1 10000 1000 30 2 9000 800 30 3 8000 500 30 4 10500 700 30 Find the…
A: Statistics is scient of counting. To count anything we need to data. We collect the data in so many…
Q: A researcher takes sample temperatures in Fahrenheit of 16 days from Miami and 14 days from Atlanta.…
A: For Miami : sample size (n1) = 16sample mean (x̄1) = Σx1 /n1 =…
Q: The following table shows the results of a repeated-measures analysis of variance comparing three…
A: Gien that; n = 9 MS ( between) = 15 F test = 3.0 By using the formula of F test we solve this…
Q: A researcher takes sample temperatures in Fahrenheit of 17 days from New York City and 18 days from…
A: A two sample t test can be used to compare the population means of two independent population. The…
Q: The time it takes (in minutes) to treat randomly selected patients in an emergency room at hospital…
A: Given : The time it takes (in minutes) to treat randomly selected patients in an emergency room at…
Q: Given below are the analysis of variance (ANOVA) results from a Minitab display. Assume that you…
A:
Q: You work for a soft-drink company in the quality control division. You are interested in the…
A: Given Information: Sample size n=16 Sample variance s2=0.012
Q: A real estate agent believes that the mean home price in the northern part of a county is higher…
A: The sample size n is 18+18=36.
Q: Given below are the analysis of variance results from same mean. ldentify the p-value. Minitab…
A: We have to find out correct answer from given options..
Q: The number of daily proposals received by a developing country's government from enterprises…
A: From the provided information, Number of observations (n) = 15
Q: Consider the five-product line produce products with the same weight (grams). Test the hypothesis of…
A: The null hypotheses is that the variance is the same for all product lines. The alternate hypothesis…
Q: The article cited in Exercise 19 provides measures of electrical conductivity (in uS/cm). The…
A: The table provides the means, standard deviations and sample sizes for electrical conductivity…

Step by step
Solved in 2 steps

- A coin operated coffee machine made by VIG corporation was designed to discharge a mean of 8 ounces of coffee per cup. If it dispenses more than that on average, the corporation may lose money, and if it dispenses less, the company may complain. BIG corporation would like to estimate the mean amount of coffee, u, dispensed per cup by this machine. BIG will choose a random sample of copper mounts dispense for this machine and use this sample to estimate u. Assuming that the standard deviation of cup amounts dispensed by this machine is 0.40 ounces, what is the minimum sample size needed in order for BIG to be 90% confident that the estimate is within 0.06 ounces of u? Carrier intermediate computation so at least three decimal places. Write your answer as a whole Number (make sure that it is the minimum hole number that satisfies the requirements).A coin-operated coffee machine made by BIG Corporation was designed to discharge a mean of eight ounces of coffee per cup. If it dispenses more than that on average, the corporation may lose money, and if it dispenses less, the customers may complain.BIG Corporation would like to estimate the mean amount of coffee, μ, dispensed per cup by this machine. BIG will choose a random sample of cup amounts dispensed by this machine and use this sample to estimate μ. Assuming that the standard deviation of cup amounts dispensed by this machine is 0.35 ounces, what is the minimum sample size needed in order for BIG to be 90% confident that its estimate is within 0.08 ounces of μ? Carry your intermediate computations to at least three decimal places. Write your answer as a whole number (and make sure that it is the minimum whole number that satisfies the requirements).A coin-operated coffee machine made by BIG Corporation was designed to discharge a mean of eight ounces of coffee per cup. If it dispenses more than that on average, the corporation may lose money, and if it dispenses less, the customers may complain. BIG Corporation would like to estimate the mean amount of coffee, μ, dispensed per cup by this machine. BIG will choose a random sample of cup amounts dispensed by this machine and use this sample to estimate μ. Assuming that the standard deviation of cup amounts dispensed by this machine is 0.43 ounces, what is the minimum sample size needed in order for BIG to be 90% confident that its estimate is within 0.08 ounces of μ? Carry your intermediate computations to at least three decimal places. Write your answer as a whole number (and make sure that it is the minimum whole number that satisfies the requirements).
- A coin-operated coffee machine made by BIG Corporation was designed to discharge a mean of eight ounces of coffee per cup. If it dispenses more than that on average, the corporation may lose money, and if it dispenses less, the customers may complain.BIG Corporation would like to estimate the mean amount of coffee, , dispensed per cup by this machine. BIG will choose a random sample of cup amounts dispensed by this machine and use this sample to estimate . Assuming that the standard deviation of cup amounts dispensed by this machine is 0.35 ounces, what is the minimum sample size needed in order for BIG to be 90% confident that its estimate is within 0.08 ounces of ?A manufacturer of bolts has a quality control policy that requires it to destroy any bolts that are more than 2 standard deviations from the mean. The quality control engineer knows that the bolts coming off the assembly line have mean length of 12 cm with a standard devation of 0.10cm. For what lengths will a bolt be destroyed?A certain prescription medicine is supposed to contain an average of 250 parts per million (ppm) of a certain chemical. If the concentration is higher than this, the drug may cause harmful side effects; if it is lower, the drug may be ineffective. The manufacturer runs a check to see if the mean concentration in a large shipment conforms to the target level of 250 ppm or not. A simple random sample of 100 portions is tested, and the sample mean concentration is found to be 247 ppm. The sample concentration standard deviation is s = 12 ppm. What are the appropriate null and alternative hypotheses? Group of answer choices H 0: x̄ = 250 vs. H a: x̄ < 250 H 0: x̄ = 250 vs. H a: x̄ ≠ 250 H 0: x̄ = 250 vs. H a: x̄ > 250 H 0: μ = 250 vs. H a:μ < 250 H 0: μ = 250 vs. H a: μ ≠ 250 H 0: μ = 250 vs. H a: μ > 250
- A certain prescription medicine is supposed to contain an average of 250 parts per million (ppm) of a certain chemical. If the concentration is higher than this, the drug may cause harmful side effects; if it is lower, the drug may be ineffective. The manufacturer runs a check to see if the mean concentration in a large shipment conforms to the target level of 250 ppm or not. A simple random sample of 100 portions is tested, and the sample mean concentration is found to be 247 ppm. The sample concentration standard deviation is s = 12 ppm. Suppose that the test statistic was -3.00. What is the p-value for this test? Group of answer choices p-value < 0.0005 0.0005 < p-value < 0.001 0.001 < p-value < 0.0025 0.002 < p-value < 0.005A certain prescription medicine is supposed to contain an average of 250 parts per million (ppm) of a certain chemical. If the concentration is higher than this, the drug may cause harmful side effects; if it is lower, the drug may be ineffective. The manufacturer runs a check to see if the mean concentration in a large shipment conforms to the target level of 250 ppm or not. A simple random sample of 100 portions is tested, and the sample mean concentration is found to be 247 ppm. The sample concentration standard deviation is s = 12 ppm. Suppose that the p-value was 0.0259. What is the appropriate conclusion to make if α = 0.05? Group of answer choices Fail to reject H0. We have insufficient evidence to conclude that the mean concentration is different from 250 ppm. Fail to reject H0. We have sufficient evidence to conclude that the mean concentration is less than 250 ppm. Reject H0. We have insufficient evidence to conclude that the mean concentration is less than 250…A certain prescription medicine is supposed to contain an average of 250 parts per million (ppm) of a certain chemical. If the concentration is higher than this, the drug may cause harmful side effects; if it is lower, the drug may be ineffective. The manufacturer runs a check to see if the mean concentration in a large shipment conforms to the target level of 250 ppm or not. A simple random sample of 100 portions is tested, and the sample mean concentration is found to be 247 ppm. The sample concentration standard deviation is s = 12 ppm. Calculate the test statistic for this test. Group of answer choices -25 -2.5 2.5 25
- A coffee manufacturer is interested in whether the mean daily consumption of regular-coffee drinkers is less than that of decaffeinated-coffee drinkers. Assume the population standard deviation for those drinking regular coffee is 3.00 cups per day and 3.16 cups per day for those drinking decaffeinated coffee. A random sample of 68 regular-coffee drinkers showed a mean of 4.44 cups per day. A sample of 58 decaffeinated-coffee drinkers showed a mean of 5.93 cups per day. Use the 0.010 significance level. a. Compute the test statistic. (Negative values should be indicated by a minus sign. Round your answers to 2 decimal places.) b. Compute the p-value. (Round your answer to 4 decimal places.)A coffee manufacturer is interested in whether the mean daily consumption of regular-coffee drinkers is less than that of decaffeinated-coffee drinkers. Assume the population standard deviation for those drinking regular coffee is 1.24 cups per day and 1.44 cups per day for those drinking decaffeinated coffee. A random sample of 49 regular-coffee drinkers showed a mean of 4.57 cups per day. A sample of 39 decaffeinated-coffee drinkers showed a mean of 5.17 cups per day. Use the 0.025 significance level. Is this a one-tailed or a two-tailed test? One-tailed test. Two-tailed test. State the decision rule. (Negative amount should be indicated by a minus sign. Round your answer to 2 decimal places.) Compute the value of the test statistic. (Negative amount should be indicated by a minus sign. Round your answer to 2 decimal places.) What is the p-value? What is your decision regarding H0? Reject H0. Do…A coffee manufacturer is interested in whether the mean daily consumption of regular-coffee drinkers is less than that of decaffeinated-coffee drinkers. Assume the population standard deviation for those drinking regular coffee is 1.20 cups per day and 1.36 cups per day for those drinking decaffeinated coffee. A random sample of 50 regular-coffee drinkers showed a mean of 4.35 cups per day. A sample of 40 decaffeinated-coffee drinkers showed a mean of 5.84 cups per day. Use the 0.01 significance level. State the decision rule. (Negative amount should be indicated by a minus sign. Round your answer to 2 decimal places.) Compute the value of the test statistic. (Negative amount should be indicated by a minus sign. Round your answer to 2 decimal places.) 3. What is the p-value ?