A real estate agent believes that the mean home price in the northern part of a county is higher than the me price in the southern part of the county and would like to test the claim. A simple random sample of housing prices is taken from each region. The results are shown below. Southern Northern Mean Variance 154.889 167.833 354.458 521.912 18 18 Observations Pooled Variance 438.185 Hypothesized Mean Difference 0 df 34 t Stat 1.885 p= Ex: 1.234 P(T<=t) one-tail 0.036 t Critical one-tail 1.691 P[T<=t) two-tail 0.072 2.032 -3 -2 -1 1 2 t Critical two-tail Confidence Level 95% 3 t = Ex: 1.234 n = Ex: 9 Degrees of freedom: df = Point estimate for the southern part of the county: ₁ = Ex: 1.234 Point estimate for the northern part of the county: ₂ = 0
A real estate agent believes that the mean home price in the northern part of a county is higher than the me price in the southern part of the county and would like to test the claim. A simple random sample of housing prices is taken from each region. The results are shown below. Southern Northern Mean Variance 154.889 167.833 354.458 521.912 18 18 Observations Pooled Variance 438.185 Hypothesized Mean Difference 0 df 34 t Stat 1.885 p= Ex: 1.234 P(T<=t) one-tail 0.036 t Critical one-tail 1.691 P[T<=t) two-tail 0.072 2.032 -3 -2 -1 1 2 t Critical two-tail Confidence Level 95% 3 t = Ex: 1.234 n = Ex: 9 Degrees of freedom: df = Point estimate for the southern part of the county: ₁ = Ex: 1.234 Point estimate for the northern part of the county: ₂ = 0

MATLAB: An Introduction with Applications
6th Edition
ISBN:9781119256830
Author:Amos Gilat
Publisher:Amos Gilat
Chapter1: Starting With Matlab
Section: Chapter Questions
Problem 1P

Related questions
Question
Transcribed Image Text:402562 2600368.qx3zqy7
Start
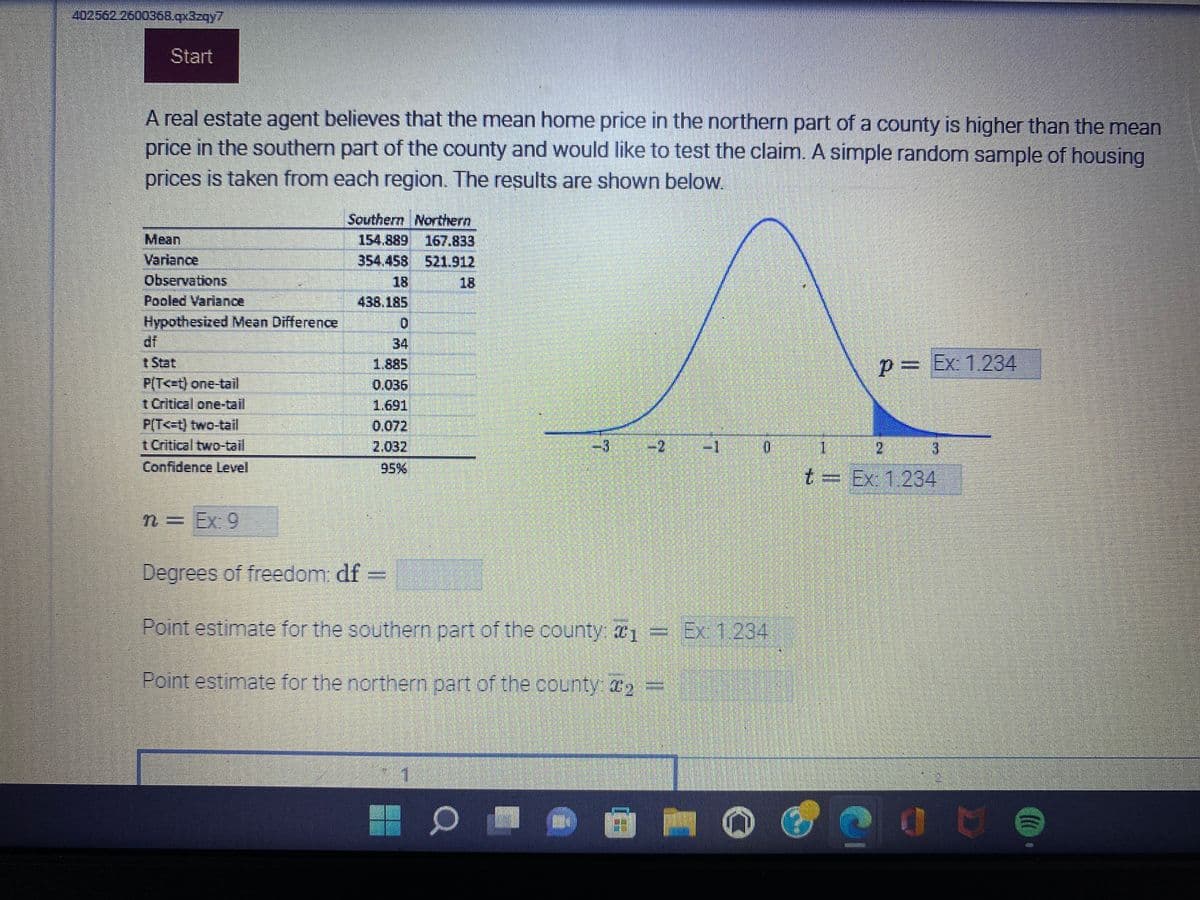
A real estate agent believes that the mean home price in the northern part of a county is higher than the mean
price in the southern part of the county and would like to test the claim. A simple random sample of housing
prices is taken from each region. The results are shown below.
Mean
Southern Northern
154.889 167.833
354.458 521.912
Variance
Observations
Pooled Variance
438.185
0
Hypothesized Mean Difference
t Stat
1.885
P= Ex: 1.234
PIT<-t) one-tail
0.036
t Critical one-tail
1.691
P(T<=t) two-tail
0.072
t Critical two-tail
2.032
2
-1
1
2
Confidence Level
95%
t = Ex: 1.234
n= Ex: 9
Degrees of freedom: df
Point estimate for the southern part of the county: 1
Ex: 1.234
Point estimate for the northern part of the county: ₂ =
J.
3
10
@
05
(CC
Expert Solution
This question has been solved!
Explore an expertly crafted, step-by-step solution for a thorough understanding of key concepts.

This is a popular solution!

Trending now
This is a popular solution!

Step by step
Solved in 2 steps

Recommended textbooks for you
MATLAB: An Introduction with Applications
Statistics
ISBN:
9781119256830
Author:
Amos Gilat
Publisher:
John Wiley & Sons Inc

Probability and Statistics for Engineering and th…
Statistics
ISBN:
9781305251809
Author:
Jay L. Devore
Publisher:
Cengage Learning

Statistics for The Behavioral Sciences (MindTap C…
Statistics
ISBN:
9781305504912
Author:
Frederick J Gravetter, Larry B. Wallnau
Publisher:
Cengage Learning
MATLAB: An Introduction with Applications
Statistics
ISBN:
9781119256830
Author:
Amos Gilat
Publisher:
John Wiley & Sons Inc
Probability and Statistics for Engineering and th…
Statistics
ISBN:
9781305251809
Author:
Jay L. Devore
Publisher:
Cengage Learning
Statistics for The Behavioral Sciences (MindTap C…
Statistics
ISBN:
9781305504912
Author:
Frederick J Gravetter, Larry B. Wallnau
Publisher:
Cengage Learning

Elementary Statistics: Picturing the World (7th E…
Statistics
ISBN:
9780134683416
Author:
Ron Larson, Betsy Farber
Publisher:
PEARSON

The Basic Practice of Statistics
Statistics
ISBN:
9781319042578
Author:
David S. Moore, William I. Notz, Michael A. Fligner
Publisher:
W. H. Freeman

Introduction to the Practice of Statistics
Statistics
ISBN:
9781319013387
Author:
David S. Moore, George P. McCabe, Bruce A. Craig
Publisher:
W. H. Freeman