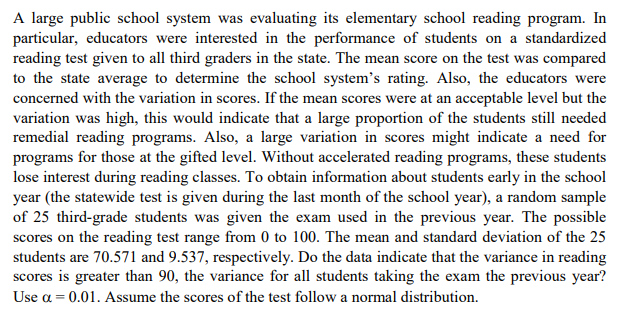
A large public school system was evaluating its elementary school reading program. In particular, educators were interested in the performance of students on a standardized reading test given to all third graders in the state. The mean score on the test was compared to the state average to determine the school system's rating. Also, the educators were concerned with the variation in scores. If the mean scores were at an acceptable level but the variation was high, this would indicate that a large proportion of the students still needed remedial reading programs. Also, a large variation in scores might indicate a need for programs for those at the gifted level. Without accelerated reading programs, these students lose interest during reading classes. To obtain information about students early in the school year (the statewide test is given during the last month of the school year), a random sample of 25 third-grade students was given the exam used in the previous year. The possible scores on the reading test range from 0 to 100. The mean and standard deviation of the 25 students are 70.571 and 9.537, respectively. Do the data indicate that the variance in reading scores is greater than 90, the variance for all students taking the exam the previous year? Use a = 0.01. ASsume the scores of the test follow a normal distribution.
A large public school system was evaluating its elementary school reading program. In particular, educators were interested in the performance of students on a standardized reading test given to all third graders in the state. The mean score on the test was compared to the state average to determine the school system's rating. Also, the educators were concerned with the variation in scores. If the mean scores were at an acceptable level but the variation was high, this would indicate that a large proportion of the students still needed remedial reading programs. Also, a large variation in scores might indicate a need for programs for those at the gifted level. Without accelerated reading programs, these students lose interest during reading classes. To obtain information about students early in the school year (the statewide test is given during the last month of the school year), a random sample of 25 third-grade students was given the exam used in the previous year. The possible scores on the reading test range from 0 to 100. The mean and standard deviation of the 25 students are 70.571 and 9.537, respectively. Do the data indicate that the variance in reading scores is greater than 90, the variance for all students taking the exam the previous year? Use a = 0.01. ASsume the scores of the test follow a normal distribution.

Glencoe Algebra 1, Student Edition, 9780079039897, 0079039898, 2018
18th Edition
ISBN:9780079039897
Author:Carter
Publisher:Carter
Chapter10: Statistics
Section10.3: Measures Of Spread
Problem 1GP

Related questions
Topic Video
Question
100%
Transcribed Image Text:A large public school system was evaluating its elementary school reading program. In
particular, educators were interested in the performance of students on a standardized
reading test given to all third graders in the state. The mean score on the test was compared
to the state average to determine the school system's rating. Also, the educators were
concerned with the variation in scores. If the mean scores were at an acceptable level but the
variation was high, this would indicate that a large proportion of the students still needed
remedial reading programs. Also, a large variation in scores might indicate a need for
programs for those at the gifted level. Without accelerated reading programs, these students
lose interest during reading classes. To obtain information about students early in the school
year (the statewide test is given during the last month of the school year), a random sample
of 25 third-grade students was given the exam used in the previous year. The possible
scores on the reading test range from 0 to 100. The mean and standard deviation of the 25
students are 70.571 and 9.537, respectively. Do the data indicate that the variance in reading
scores is greater than 90, the variance for all students taking the exam the previous year?
Use a = 0.01. Assume the scores of the test follow a normal distribution.
Expert Solution
This question has been solved!
Explore an expertly crafted, step-by-step solution for a thorough understanding of key concepts.

This is a popular solution!

Trending now
This is a popular solution!

Step by step
Solved in 2 steps

Knowledge Booster


Learn more about
Need a deep-dive on the concept behind this application? Look no further. Learn more about this topic, statistics and related others by exploring similar questions and additional content below.Recommended textbooks for you
Glencoe Algebra 1, Student Edition, 9780079039897…
Algebra
ISBN:
9780079039897
Author:
Carter
Publisher:
McGraw Hill
Glencoe Algebra 1, Student Edition, 9780079039897…
Algebra
ISBN:
9780079039897
Author:
Carter
Publisher:
McGraw Hill