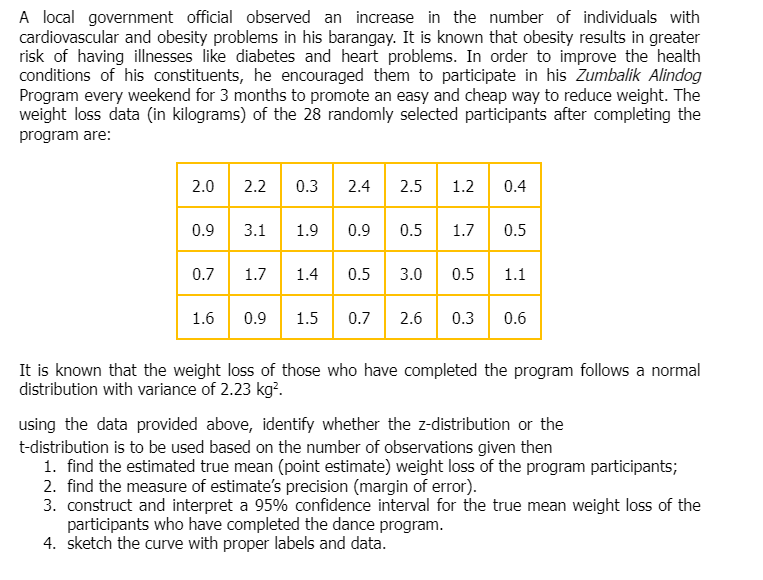
A local government official observed an increase in the number of individuals with cardiovascular and obesity problems in his barangay. It is known that obesity results in greater risk of having illnesses like diabetes and heart problems. In order to improve the health conditions of his constituents, he encouraged them to participate in his Zumbalik Alindog Program every weekend for 3 months to promote an easy and cheap way to reduce weight. The weight loss data (in kilograms) of the 28 randomly selected participants after completing the program are: 2.0 2.2 0.3 2.4 2.5 1.2 0.4 0.9 3.1 1.9 0.9 0.5 1.7 0.5 0.7 1.7 1.4 0.5 3.0 0.5 1.1 1.6 0.9 1.5 0.7 2.6 0.3 0.6 It is known that the weight loss of those who have completed the program follows a normal distribution with variance of 2.23 kg². using the data provided above, identify whether the z-distribution or the t-distribution is to be used based on the number of observations given then 1. find the estimated true mean (point estimate) weight loss of the program participants; 2. find the measure of estimate's precision (margin of error). 3. construct and interpret a 95% confidence interval for the true mean weight loss of the participants who have completed the dance program.
A local government official observed an increase in the number of individuals with cardiovascular and obesity problems in his barangay. It is known that obesity results in greater risk of having illnesses like diabetes and heart problems. In order to improve the health conditions of his constituents, he encouraged them to participate in his Zumbalik Alindog Program every weekend for 3 months to promote an easy and cheap way to reduce weight. The weight loss data (in kilograms) of the 28 randomly selected participants after completing the program are: 2.0 2.2 0.3 2.4 2.5 1.2 0.4 0.9 3.1 1.9 0.9 0.5 1.7 0.5 0.7 1.7 1.4 0.5 3.0 0.5 1.1 1.6 0.9 1.5 0.7 2.6 0.3 0.6 It is known that the weight loss of those who have completed the program follows a normal distribution with variance of 2.23 kg². using the data provided above, identify whether the z-distribution or the t-distribution is to be used based on the number of observations given then 1. find the estimated true mean (point estimate) weight loss of the program participants; 2. find the measure of estimate's precision (margin of error). 3. construct and interpret a 95% confidence interval for the true mean weight loss of the participants who have completed the dance program.

Glencoe Algebra 1, Student Edition, 9780079039897, 0079039898, 2018
18th Edition
ISBN:9780079039897
Author:Carter
Publisher:Carter
Chapter10: Statistics
Section10.3: Measures Of Spread
Problem 1GP

Related questions
Question
please do this typewritten and completely so I will upvote. Thank you and much appreciated for the help.
Transcribed Image Text:A local government official observed an increase in the number of individuals with
cardiovascular and obesity problems in his barangay. It is known that obesity results in greater
risk of having illnesses like diabetes and heart problems. In order to improve the health
conditions of his constituents, he encouraged them to participate in his Zumbalik Alindog
Program every weekend for 3 months to promote an easy and cheap way to reduce weight. The
weight loss data (in kilograms) of the 28 randomly selected participants after completing the
program are:
2.0 2.2 0.3 2.4 2.5 1.2 0.4
0.9 3.1 1.9
0.9
90.5
1.7
0.5
0.7
1.7
1.4 0.5 3.0 0.5 1.1
1.6
0.9 1.5 0.7 2.6 0.3 0.6
It is known that the weight loss of those who have completed the program follows a normal
distribution with variance of 2.23 kg².
using the data provided above, identify whether the z-distribution or the
t-distribution is to be used based on the number of observations given then
1. find the estimated true mean (point estimate) weight loss of the program participants;
2. find the measure of estimate's precision (margin of error).
3. construct and interpret a 95% confidence interval for the true mean weight loss of the
participants who have completed the dance program.
4. sketch the curve with proper labels and data.
Expert Solution
This question has been solved!
Explore an expertly crafted, step-by-step solution for a thorough understanding of key concepts.

Step by step
Solved in 4 steps with 4 images

Recommended textbooks for you
Glencoe Algebra 1, Student Edition, 9780079039897…
Algebra
ISBN:
9780079039897
Author:
Carter
Publisher:
McGraw Hill
Glencoe Algebra 1, Student Edition, 9780079039897…
Algebra
ISBN:
9780079039897
Author:
Carter
Publisher:
McGraw Hill