a) Make a frequency distribution table with columns labeled: Position, Tally, Frequency, and Relative Frequency. Next, label the rows with the positions. pase 2 Position Frequency D. 6-K 3. Total: 3 b) Fill in the first 3 columns of the frequency distribution table then total the number of players, Ef. 23% c) What percent of players are GK? You can find the percent by taking the number of GK and dividing by the total number of players. This is the number (or frequency) of GK relative to the rest of the team. Use this concept to complete the last column, the relative frequency column. Round to the nearest whole number. 306
a) Make a frequency distribution table with columns labeled: Position, Tally, Frequency, and Relative Frequency. Next, label the rows with the positions. pase 2 Position Frequency D. 6-K 3. Total: 3 b) Fill in the first 3 columns of the frequency distribution table then total the number of players, Ef. 23% c) What percent of players are GK? You can find the percent by taking the number of GK and dividing by the total number of players. This is the number (or frequency) of GK relative to the rest of the team. Use this concept to complete the last column, the relative frequency column. Round to the nearest whole number. 306

Big Ideas Math A Bridge To Success Algebra 1: Student Edition 2015
1st Edition
ISBN:9781680331141
Author:HOUGHTON MIFFLIN HARCOURT
Publisher:HOUGHTON MIFFLIN HARCOURT
Chapter11: Data Analysis And Displays
Section11.3: Shapes Of Distributions
Problem 8Q

Related questions
Question
100%
Make a frequency distribution table with columns labeled : position, tally, frequency, and relative frequency. Next label the rows with position.
Transcribed Image Text:use to political leanings. Visual representations of data are throughout the media and In everyday
lives. It is important to be able to interpret these graphs so that we understand what the creator is
trying to purvey.
Learning Goals: Multiple Representations, Problem Solving, Communication
Read and interpret graphical representations
Create a frequency distribution for a data set
Use the Empirical Rule to find probabilities/percentages
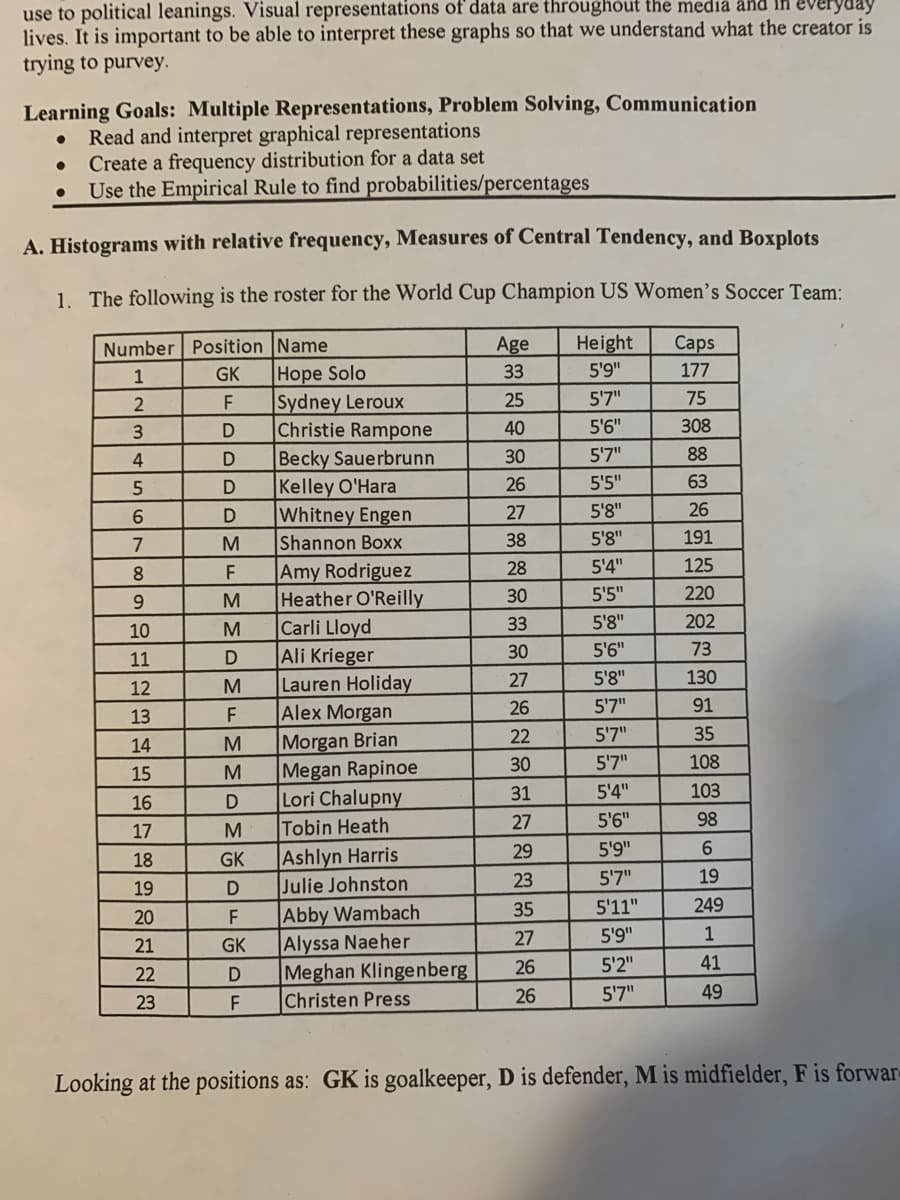
A. Histograms with relative frequency, Measures of Central Tendency, and Boxplots
1. The following is the roster for the World Cup Champion US Women's Soccer Team:
Number Position Name
Age
Height
Сaps
Hope Solo
|Sydney Leroux
Christie Rampone
Becky Sauerbrunn
Kelley O'Hara
Whitney Engen
Shannon Boxx
1
GK
33
5'9"
177
F
25
5'7"
75
3
40
5'6"
308
4
30
5'7"
88
26
5'5"
63
D
27
5'8"
26
7
M
38
5'8"
191
|Amy Rodriguez
Heather O'Reilly
Carli Lloyd
Ali Krieger
Lauren Holiday
Alex Morgan
Morgan Brian
Megan Rapinoe
Lori Chalupny
Tobin Heath
8.
F
28
5'4"
125
30
5'5"
220
9.
33
5'8"
202
10
30
5'6"
73
11
27
5'8"
130
12
26
5'7"
91
13
22
5'7"
35
14
30
5'7"
108
15
31
5'4"
103
16
27
5'6"
98
17
5'9"
6.
|Ashlyn Harris
Julie Johnston
Abby Wambach
|Alyssa Naeher
Meghan Klingenberg
Christen Press
29
18
GK
23
5'7"
19
19
35
5'11"
249
20
27
5'9"
1
21
GK
26
5'2"
41
22
26
5'7"
49
23
Looking at the positions as: GK is goalkeeper, D is defender, M is midfielder, F is forwar-
MMDMFEMDMD
Transcribed Image Text:Math 47 - Lab 3
Ch 12, 13, 14
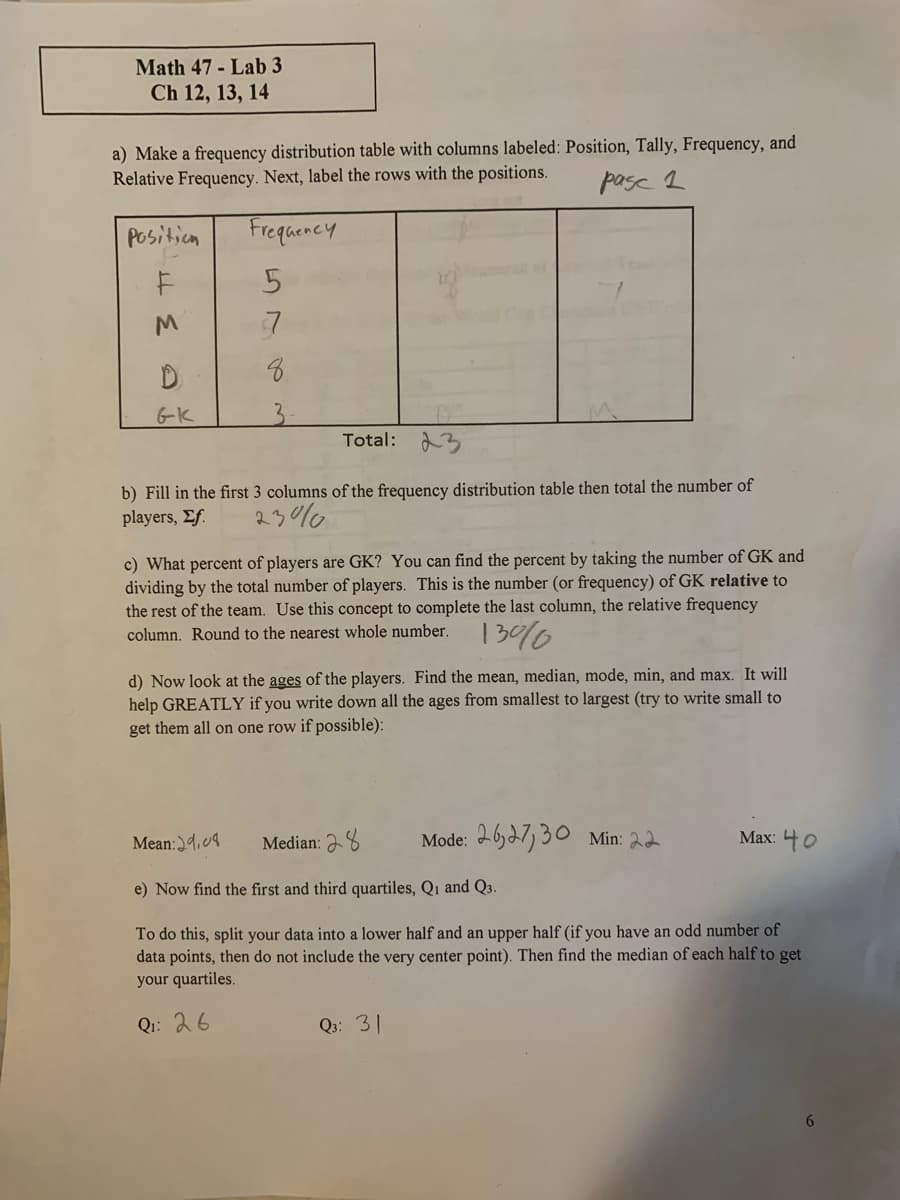
a) Make a frequency distribution table with columns labeled: Position, Tally, Frequency, and
Relative Frequency. Next, label the rows with the positions.
pase 2
Positicn
Frequency
G-K
3.
Total: 3
b) Fill in the first 3 columns of the frequency distribution table then total the number of
players, Ef.
23%6
c) What percent of players are GK? You can find the percent by taking the number of GK and
dividing by the total number of players. This is the number (or frequency) of GK relative to
the rest of the team. Use this concept to complete the last column, the relative frequency
column. Round to the nearest whole number.
|3%6
d) Now look at the ages of the players. Find the mean, median, mode, min, and max. It will
help GREATLY if you write down all the ages from smallest to largest (try to write small to
get them all on one row if possible):
Mean:4,09
Median: 28
Mode: 26,27, 30 Min: 22
Мax: 40
e) Now find the first and third quartiles, Qi and Q3.
To do this, split your data into a lower half and an upper half (if you have an odd number of
data points, then do not include the very center point). Then find the median of each half to get
your quartiles.
Qi: 26
Q3: 31
6.
Expert Solution
This question has been solved!
Explore an expertly crafted, step-by-step solution for a thorough understanding of key concepts.

Step by step
Solved in 2 steps with 3 images

Knowledge Booster


Learn more about
Need a deep-dive on the concept behind this application? Look no further. Learn more about this topic, statistics and related others by exploring similar questions and additional content below.Recommended textbooks for you
Big Ideas Math A Bridge To Success Algebra 1: Stu…
Algebra
ISBN:
9781680331141
Author:
HOUGHTON MIFFLIN HARCOURT
Publisher:
Houghton Mifflin Harcourt

Glencoe Algebra 1, Student Edition, 9780079039897…
Algebra
ISBN:
9780079039897
Author:
Carter
Publisher:
McGraw Hill
Big Ideas Math A Bridge To Success Algebra 1: Stu…
Algebra
ISBN:
9781680331141
Author:
HOUGHTON MIFFLIN HARCOURT
Publisher:
Houghton Mifflin Harcourt
Glencoe Algebra 1, Student Edition, 9780079039897…
Algebra
ISBN:
9780079039897
Author:
Carter
Publisher:
McGraw Hill