A manufacturer of cellular phone batteries took a sample of 13 from a day's production and used them continuously until they were drained. The numbers of hours they were used until failure were Summary Statistics Hours to Failure 151 105 139 153 141 147 Average (1) = 174.231 Standard deviation (s) = 93.4801 Lower quartile 139.0 Interquartile range 14.0 147 122 385 159 139 377 100 Note: s n-1고 Based on the data and partial summary statistics above in the table, calculate the following statistics. (a) The minimum of the sample is (b) The maximum of the sample is (c) The median of the sample is (a whole number) (d) Write down one mode of the sample (a whole number) (e) The variance of the sample is (round to the nearest 0.1) (f) The range of the sample is (a whole number) E) The upper quartile is (a whole number)
A manufacturer of cellular phone batteries took a sample of 13 from a day's production and used them continuously until they were drained. The numbers of hours they were used until failure were Summary Statistics Hours to Failure 151 105 139 153 141 147 Average (1) = 174.231 Standard deviation (s) = 93.4801 Lower quartile 139.0 Interquartile range 14.0 147 122 385 159 139 377 100 Note: s n-1고 Based on the data and partial summary statistics above in the table, calculate the following statistics. (a) The minimum of the sample is (b) The maximum of the sample is (c) The median of the sample is (a whole number) (d) Write down one mode of the sample (a whole number) (e) The variance of the sample is (round to the nearest 0.1) (f) The range of the sample is (a whole number) E) The upper quartile is (a whole number)

MATLAB: An Introduction with Applications
6th Edition
ISBN:9781119256830
Author:Amos Gilat
Publisher:Amos Gilat
Chapter1: Starting With Matlab
Section: Chapter Questions
Problem 1P

Related questions
Question
D-G
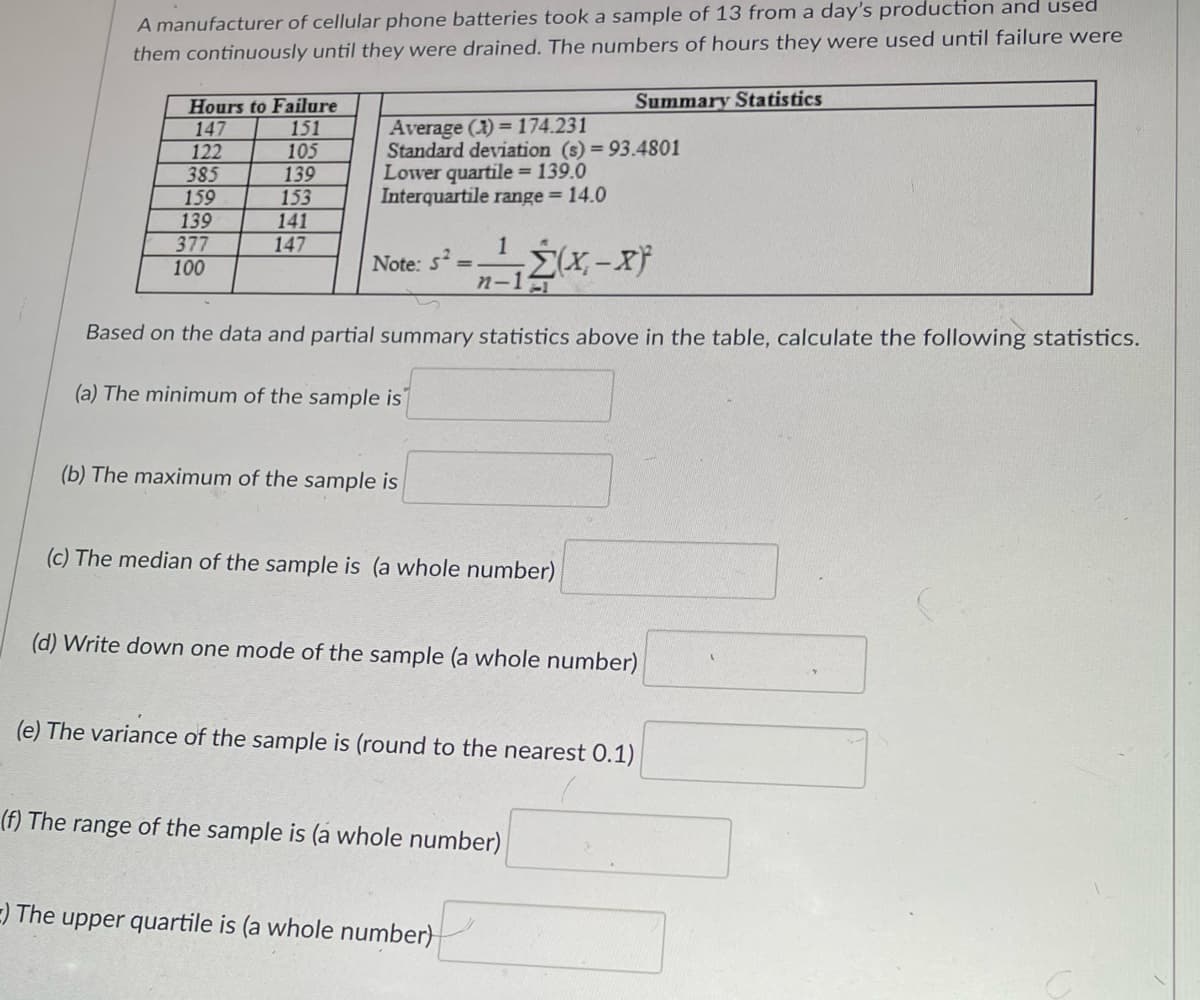
Transcribed Image Text:A manufacturer of cellular phone batteries took a sample of 13 from a day's production and used
them continuously until they were drained. The numbers of hours they were used until failure were
Summary Statistics
Hours to Failure
151
105
139
153
141
147
Average (1) = 174.231
Standard deviation (s) = 93.4801
Lower quartile = 139.0
Interquartile range = 14.0
147
122
385
159
139
377
100
Note: s
n-1
Based on the data and partial summary statistics above in the table, calculate the following statistics.
(a) The minimum of the sample is
(b) The maximum of the sample is
(c) The median of the sample is (a whole number)
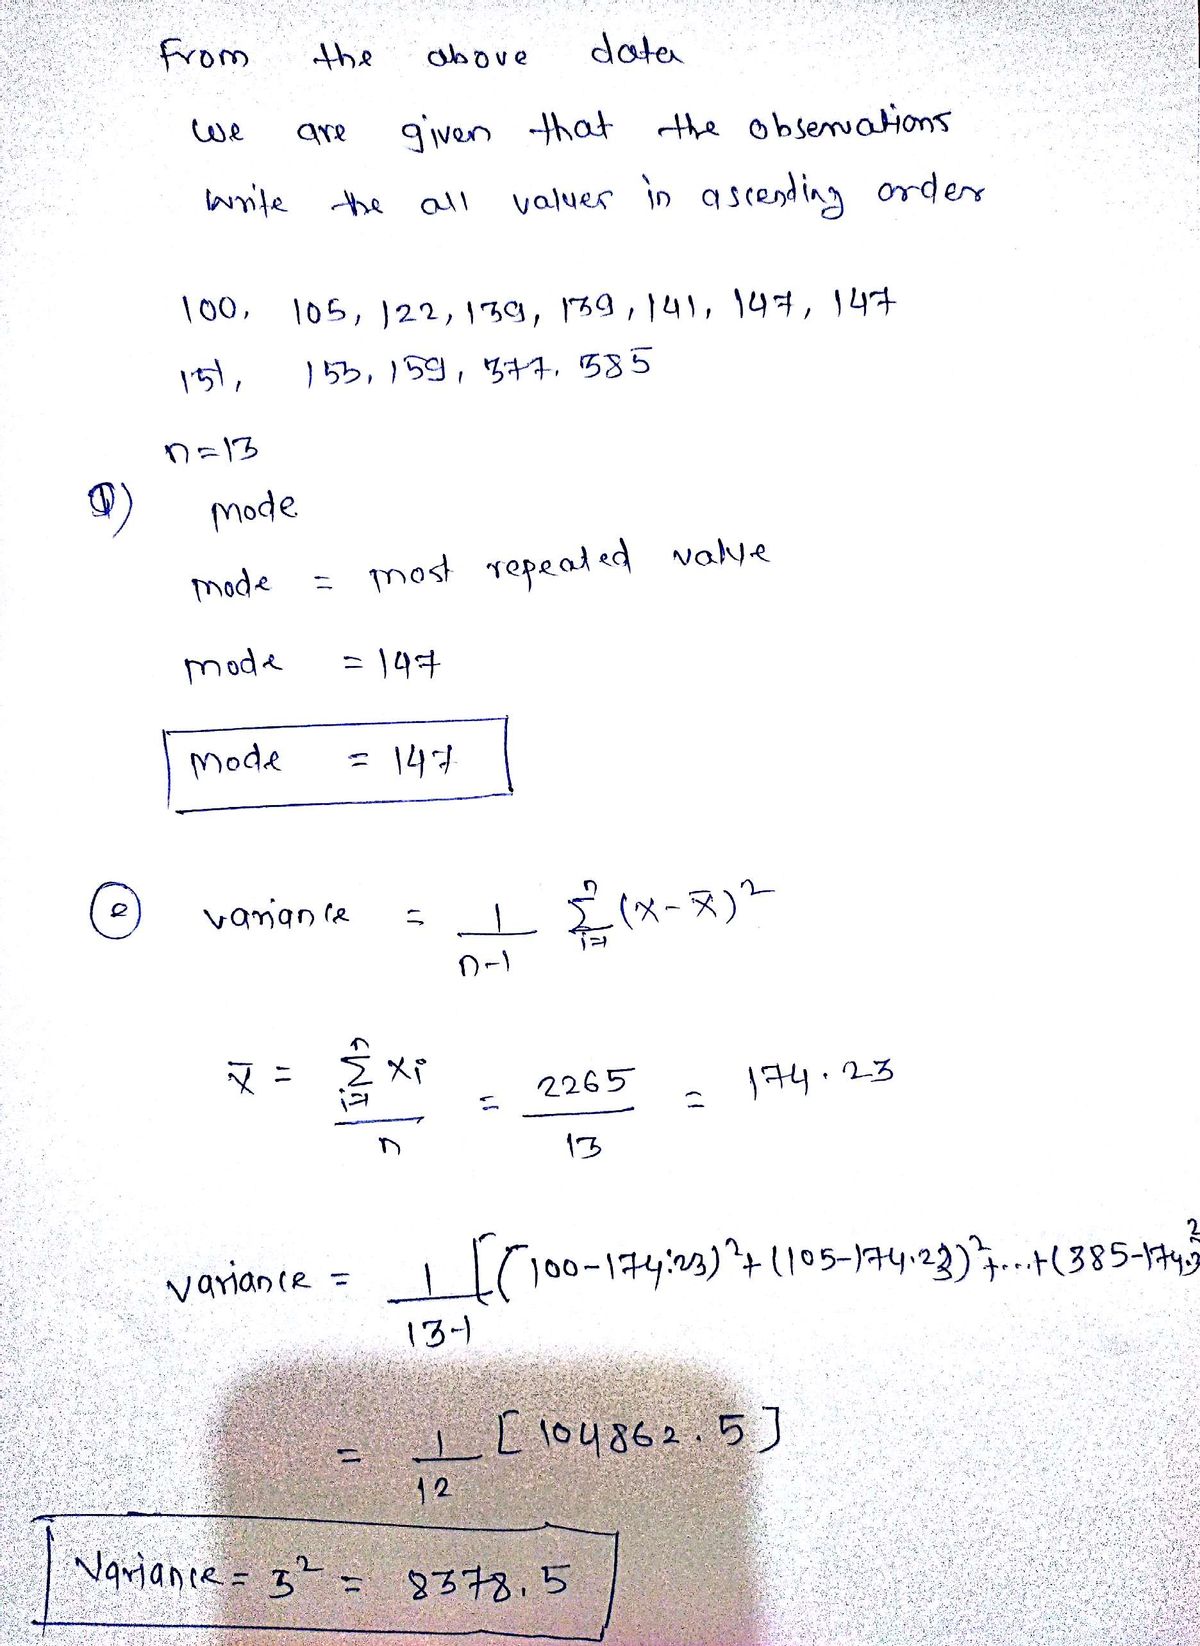
(d) Write down one mode of the sample (a whole number)
(e) The variance of the sample is (round to the nearest 0.1)
(f) The range of the sample is (a whole number)
) The upper quartile is (a whole number)
Expert Solution
Step 1

Step by step
Solved in 2 steps with 2 images

Recommended textbooks for you
MATLAB: An Introduction with Applications
Statistics
ISBN:
9781119256830
Author:
Amos Gilat
Publisher:
John Wiley & Sons Inc

Probability and Statistics for Engineering and th…
Statistics
ISBN:
9781305251809
Author:
Jay L. Devore
Publisher:
Cengage Learning

Statistics for The Behavioral Sciences (MindTap C…
Statistics
ISBN:
9781305504912
Author:
Frederick J Gravetter, Larry B. Wallnau
Publisher:
Cengage Learning
MATLAB: An Introduction with Applications
Statistics
ISBN:
9781119256830
Author:
Amos Gilat
Publisher:
John Wiley & Sons Inc
Probability and Statistics for Engineering and th…
Statistics
ISBN:
9781305251809
Author:
Jay L. Devore
Publisher:
Cengage Learning
Statistics for The Behavioral Sciences (MindTap C…
Statistics
ISBN:
9781305504912
Author:
Frederick J Gravetter, Larry B. Wallnau
Publisher:
Cengage Learning

Elementary Statistics: Picturing the World (7th E…
Statistics
ISBN:
9780134683416
Author:
Ron Larson, Betsy Farber
Publisher:
PEARSON

The Basic Practice of Statistics
Statistics
ISBN:
9781319042578
Author:
David S. Moore, William I. Notz, Michael A. Fligner
Publisher:
W. H. Freeman

Introduction to the Practice of Statistics
Statistics
ISBN:
9781319013387
Author:
David S. Moore, George P. McCabe, Bruce A. Craig
Publisher:
W. H. Freeman