A marine biologist claims that the mean length of mature female pink seaperch is different in fall and winter. A sample of 12 mature female pink seaperch collected in fall has a mean length of 106 millimeters and a standard deviation of 15 millimeters. A sample of 10 mature female pink seaperch collected in winter has a mean length of 102 millimeters and a standard deviation of 11 millimeters. At a = 0.01, can you support the marine biologist's claim? Assume the population variances are equal. Assume the samples are random and independent, and the populations are normally distributed. Complete parts (a) through (e) below. (a) Identify the claim and state Ho and Ha Which is the correct claim below? O A. "The mean length of mature female pink seaperch is greater in the winter than in the fall." OB. The mean length of mature female pink seaperch is the same in fall and winter." OC. "The mean length of mature female pink seaperch is greater in the fall than in the winter." OD. The mean length of mature female pink seaperch is different in fall and winter." What are Ho and Ha? The null hypothesis, Ho, is V The alternative hypothesis, Ha, is Which hypothesis is the claim? O The alternative hypothesis, Ha O The null hypothesis, Ho (b) Find the critical value(s) and identify the rejection region(s). Enter the critical value(s) below. (Type an integer or decimal rounded to three decimal places as needed. Use a comma to separate answers as needed.) Select the correct rejection region(s) below. OA. t< -to OB. t>o oc -6 to (c) Find the standardized test statistic. t%3(Type an integer or decimal rounded to three decimal places as needed.)
A marine biologist claims that the mean length of mature female pink seaperch is different in fall and winter. A sample of 12 mature female pink seaperch collected in fall has a mean length of 106 millimeters and a standard deviation of 15 millimeters. A sample of 10 mature female pink seaperch collected in winter has a mean length of 102 millimeters and a standard deviation of 11 millimeters. At a = 0.01, can you support the marine biologist's claim? Assume the population variances are equal. Assume the samples are random and independent, and the populations are normally distributed. Complete parts (a) through (e) below. (a) Identify the claim and state Ho and Ha Which is the correct claim below? O A. "The mean length of mature female pink seaperch is greater in the winter than in the fall." OB. The mean length of mature female pink seaperch is the same in fall and winter." OC. "The mean length of mature female pink seaperch is greater in the fall than in the winter." OD. The mean length of mature female pink seaperch is different in fall and winter." What are Ho and Ha? The null hypothesis, Ho, is V The alternative hypothesis, Ha, is Which hypothesis is the claim? O The alternative hypothesis, Ha O The null hypothesis, Ho (b) Find the critical value(s) and identify the rejection region(s). Enter the critical value(s) below. (Type an integer or decimal rounded to three decimal places as needed. Use a comma to separate answers as needed.) Select the correct rejection region(s) below. OA. t< -to OB. t>o oc -6 to (c) Find the standardized test statistic. t%3(Type an integer or decimal rounded to three decimal places as needed.)

MATLAB: An Introduction with Applications
6th Edition
ISBN:9781119256830
Author:Amos Gilat
Publisher:Amos Gilat
Chapter1: Starting With Matlab
Section: Chapter Questions
Problem 1P

Related questions
Topic Video
Question
A marine biologist claims that the mean length of mature female pink seaperch is different in fall and winter. A sample of 12 mature female pink seaperch collected in fall has a mean length of 106 millimeters and a standard deviation of 15 millimeters. A sample of 10 mature female pink seaperch collected in winter has a mean length of 102 millimeters and a standard deviation ofV11 millimeters. At α=0.01, can you support the marine biologist's claim? Assume the population variances are equal. Assume the samples are random and independent, and the populations are
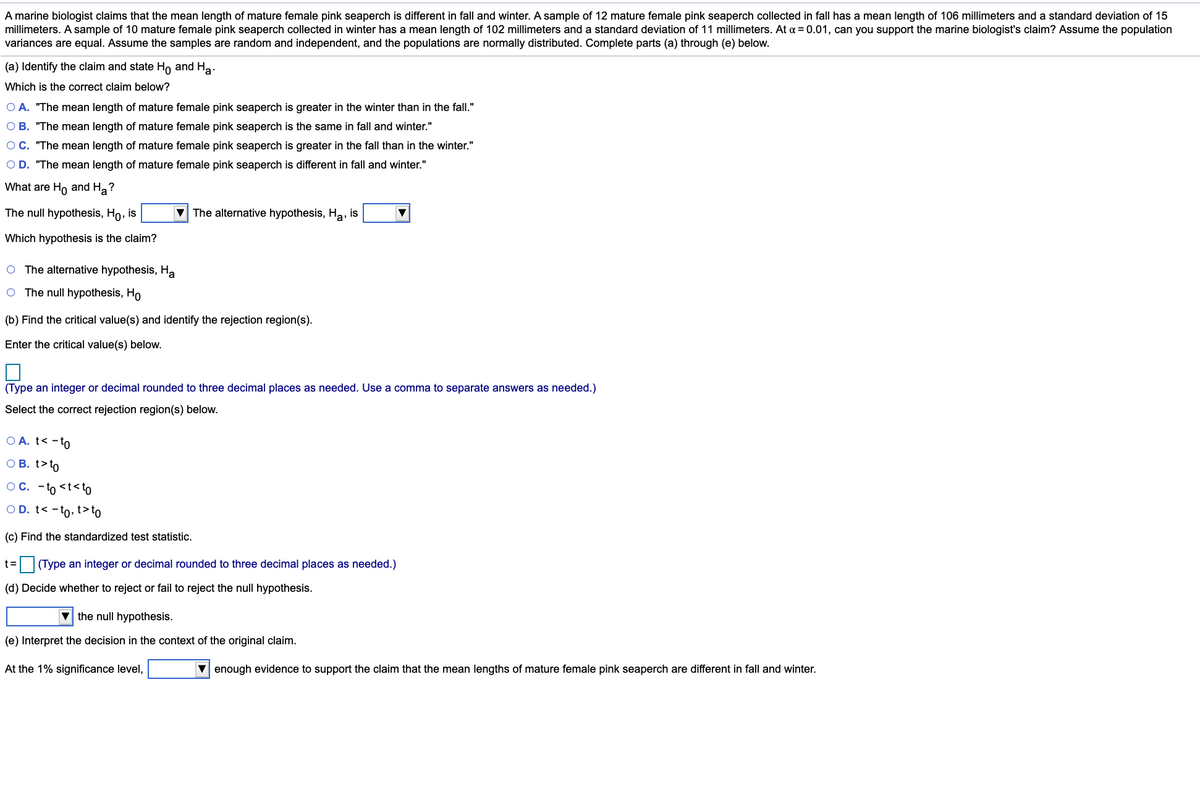
Transcribed Image Text:A marine biologist claims that the mean length of mature female pink seaperch is different in fall and winter. A sample of 12 mature female pink seaperch collected in fall has a mean length of 106 millimeters and a standard deviation of 15
millimeters. A sample of 10 mature female pink seaperch collected in winter has a mean length of 102 millimeters and a standard deviation of 11 millimeters. At a = 0.01, can you support the marine biologist's claim? Assume the population
variances are equal. Assume the samples are random and independent, and the populations are normally distributed. Complete parts (a) through (e) below.
(a) Identify the claim and state Ho and Ha.
Which is the correct claim below?
O A. "The mean length of mature female pink seaperch is greater in the winter than in the fall."
O B. "The mean length of mature female pink seaperch is the same in fall and winter."
OC. "The mean length of mature female pink seaperch is greater in the fall than in the winter."
O D. "The mean length of mature female pink seaperch is different in fall and winter."
What are Ho and H?
The null hypothesis, Ho, is
V The alternative hypothesis, Ha, is
Which hypothesis is the claim?
O The alternative hypothesis, Ha
O The null hypothesis, Ho
(b) Find the critical value(s) and identify the rejection region(s).
Enter the critical value(s) below.
(Type an integer or decimal rounded to three decimal places as needed. Use a comma to separate answers as needed.)
Select the correct rejection region(s) below.
O A. t< -to
O B. t>to
OC. - to <t<to
OD. t< - to, t> to
(c) Find the standardized test statistic.
%3=
(Type an integer or decimal rounded to three decimal places as needed.)
(d) Decide whether to reject or fail to reject the null hypothesis.
V the null hypothesis.
(e) Interpret the decision in the context of the original claim.
At the 1% significance level,
V enough evidence to support the claim that the mean lengths of mature female pink seaperch are different in fall and winter.
Expert Solution
This question has been solved!
Explore an expertly crafted, step-by-step solution for a thorough understanding of key concepts.

This is a popular solution!

Trending now
This is a popular solution!

Step by step
Solved in 2 steps with 1 images

Knowledge Booster


Learn more about
Need a deep-dive on the concept behind this application? Look no further. Learn more about this topic, statistics and related others by exploring similar questions and additional content below.Recommended textbooks for you
MATLAB: An Introduction with Applications
Statistics
ISBN:
9781119256830
Author:
Amos Gilat
Publisher:
John Wiley & Sons Inc

Probability and Statistics for Engineering and th…
Statistics
ISBN:
9781305251809
Author:
Jay L. Devore
Publisher:
Cengage Learning

Statistics for The Behavioral Sciences (MindTap C…
Statistics
ISBN:
9781305504912
Author:
Frederick J Gravetter, Larry B. Wallnau
Publisher:
Cengage Learning
MATLAB: An Introduction with Applications
Statistics
ISBN:
9781119256830
Author:
Amos Gilat
Publisher:
John Wiley & Sons Inc
Probability and Statistics for Engineering and th…
Statistics
ISBN:
9781305251809
Author:
Jay L. Devore
Publisher:
Cengage Learning
Statistics for The Behavioral Sciences (MindTap C…
Statistics
ISBN:
9781305504912
Author:
Frederick J Gravetter, Larry B. Wallnau
Publisher:
Cengage Learning

Elementary Statistics: Picturing the World (7th E…
Statistics
ISBN:
9780134683416
Author:
Ron Larson, Betsy Farber
Publisher:
PEARSON

The Basic Practice of Statistics
Statistics
ISBN:
9781319042578
Author:
David S. Moore, William I. Notz, Michael A. Fligner
Publisher:
W. H. Freeman

Introduction to the Practice of Statistics
Statistics
ISBN:
9781319013387
Author:
David S. Moore, George P. McCabe, Bruce A. Craig
Publisher:
W. H. Freeman