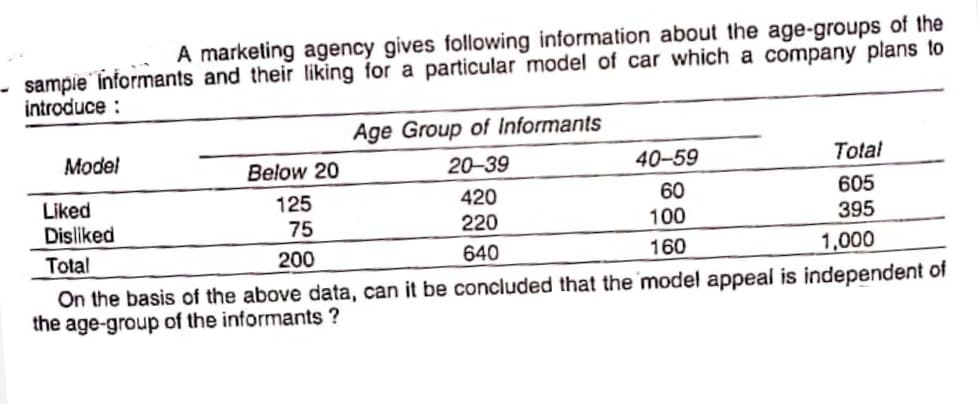
A marketing agency gives following information about the age-groups of the - sampie informants and their liking for a particular model of car which a company plans to introduce : Age Group of Informants Model Below 20 20-39 40-59 Total 605 395 420 Liked Disliked 125 75 60 100 220 Total 200 640 160 1,000 On the basis of the above data, can it be concluded that the model appeal is independent of the age-group of the informants ?


Q: The health center head got the report that the median age of under-five children who visited the und...
A: Given Information: The median age of under-five children who visited the under-five OPD is 34 months...
Q: 3. An agronomist breed two rice varieties which are X variety that are long and aromatic grain and Y...
A: Chi-Square analysis analyzes the difference between the observed and expected value. It is a statist...
Q: The money raised and spent (both in millions of dollars) by all congressional campaigns for 8 recent...
A: The coefficient of determination is the percentage of variation in y explained by the variable x. Co...
Q: Draw a cumulative frequency curve for the following data : Marks No. of students Marks No. of studen...
A:
Q: answer c & d only
A: Given X~Nμ1,σ12 with sample size nY~Nμ2,σ22 with sample size m
Q: In 1970, 90% of 30-year-olds in a country earned more than their parents did at age 30 (adjusted for...
A: Given,P(in 1970 , 30 years old in a country earned more than their parents)=0.90P(in 2014 , 30 years...
Q: TRUE OR FALSE 1. From the Kaplan-Meier approach of estimating survival probabilities, we can see if...
A: Kaplan Meier Method for Survival Probabilities: Kaplan Meier is a statistical method that analyses t...
Q: С. (x- mean)^2*P(x) x=# hours P(x) x*P(x) x^2*P(x) 1 0.08 0.08 0.79077888 0.08 0.152 0.304 0.6987038...
A: Given : x=# hours P(x) 1 0.08 2 0.152 3 0.212 4 0.18 5 0.16 6 0.052 7 0.02 8 0.1...
Q: aq* + k (a > 0, b > 0, k 2 0 ) then MC= abq*-l and Marginal Example 14. Show that ifT= h-1 b-2 k ave...
A:
Q: Suppose that 2 balls are randomly selected (without replacement) from an urn containing 3 red, 4 blu...
A: Given Information: Total number of balls in the urn is 12. Number of red balls is 3 Number of Blue b...
Q: Yij - y = yij – J,. = yj - , + , -y. Given %3D | (Yj – y)? [(Yj – Y;) + Cỹ, – y) - - i. be
A: Given that yij-y¯..=yij-y¯i.+y¯i.-y¯.......................(1)yij-y¯..2=yij-y¯i.+y¯i.-y¯..2............
Q: Example 7-35. Four tickets are drawn, one at a time with replacement, from a set of ten tickets numb...
A:
Q: A player tosses two fair coins. He wins $ 5 if 2 heads occur, $ 2 if 1 head occurs and 1 if no head ...
A:
Q: In a trivariate distribution: 01 = 3, 02 = 4, a3 = 5 r23 = 0-4, 31 = 06, n3 = 07 Determine the regre...
A:
Q: Bottles of purified water are assumed to contain 250 milliliters of water. There is some variation f...
A: Claim : The mean amount of water in all the bottles filled that day differs from the target value of...
Q: Which of the following statements is NOT TRUE about measures of variability? a. Range is a quick but...
A: Option C is correct because the value of variance is always nonnegative And as we know that rang...
Q: Joe will study for the quiz on which he is likely to do worse by guessing. Which quiz should he stud...
A: here use binomial theorem Each trial is independent Finite number of trial There are two outcomes ...
Q: Consider the Box whisker plot diagram for a set of data; хх 8 10 13 14 15 19 20 22 Q1 Q2 Q3
A:
Q: In a simple linear regression model, B1 has important relationships with a sample correlation coeffi...
A: (1) To prove β^1=rSyySxx The general form of regression equation is Y=β0+β1X+ε By minimizing the lea...
Q: Generate a 95% confidence interval for the difference in mean ages between groups. Generate a 95%...
A: Solution:
Q: 5.2.35-T Question Help A pharmaceutical company recelves large shipments of aspirin tablets. The acc...
A:
Q: A dinical trial was conducted to test the effectiveness of a drug for treating insomnia in older sub...
A:
Q: Find the mean deviation about median for the followin distribution : x: 5 f: 9 11 13 15 17 2 4 6 8 1...
A:
Q: A study was conducted among 554 under-five children to investigate the association between place of ...
A: Given, A study was conducted among 554 under-five children to investigate the association between pl...
Q: a large population of adults, the mean IQ is 116 with a standard deviation of 20. Suppose 50 adults ...
A:
Q: 1. Calculate the batting runs for the top five home run hitters of all time, for the season in which...
A: @solution::: Batting Runs is the straight loads worth of a player, which is adapted to the player'...
Q: A solution of a differential equation that is free of arbitrary parameters is called a/an solution.
A: Particular solution. A solution of a differential equation that is free of arbitrary parameter is ...
Q: Suppose that a new treatment is successful in curing a common ailment 75% of the time. If the treatm...
A:
Q: A real number between 0 and 10 will be picked according to the probability distribution shown in the...
A: given;a real number between 0 and 10 will be picked according to the probability distribution shown ...
Q: Ha: p< 0.65 A sample of 300 items was selected. Compute the p-value and state your conclusion for ea...
A: GivenH0:p≥0.65Ha:p<0.65sample size(n)=300α=0.05
Q: 1a) Write 17 x 16 x 15 x 14 x 13 x 12 x 11 x 10 x 9 x 8 in the form „P. 1b) Express 21C, as a sum of...
A: Here AS PER POLICY I HAVE CALCULATED 3 SUBPARTS PLZ REPOST FOR REMAINING PARTS HERE USE COMBINATION...
Q: (a) The standard normal curve is graphed below. Shade the region under the standard normal curve to ...
A: Given , z be a standard normal curve.z~N(μ,σ)where μ=0 and σ=1
Q: 2. How do you compute for the variance and standard deviation of the sampling distribution of sample...
A: “Since you have asked multiple questions, we will solve the first question for you. If you want any ...
Q: The probability distribution for a discrete random variable is given below: X 4 6 8...
A: Given that Probability distribution table X 4 6 8 10 P(x) 0.40 0.10 0.20 0.30 We know th...
Q: What is the probability that the mean number of minutes of daily activity of the 66 mildly obese peo...
A: Given: Mean no. of minutes of daily activity of mildly obese people, μ1=365sd of of daily activity o...
Q: A. Direction: Read the following statements carefully. Write ND if the statement describes a charact...
A: ND is written if the statement describes a characteristic of a normal distribution and NND is writte...
Q: Chapter 06, Section 6.3, Problem 035 The pucks used by the National Hockey League for ice hockey mus...
A:
Q: Normal blood sugar levels are less than 100 mg/dL after fasting for at least eight hours. A sample o...
A:
Q: Exercise 08.13 Algo (Population Mean: Sigma Unknown) The following sample data are from a normal pop...
A: The following sample is given: 10, 8, 12, 14, 13, 11, 7 , 5.
Q: It appears that people who are mildly obese are less active than leaner people. One study looked at ...
A: a. Consider that the mean and standard deviation of a random variable X are µ and σ, respectively. T...
Q: III I Compute median from the following data: Frequency Frequency 60 Mid -vulue mid-value 115 165 12...
A:
Q: Out of a sample of 10,000 men, the probability that a man picked at random weighs over 190 pounds is...
A: GivenThe probability that a man picked at random weighs over 190 pounds = 0.25The probability that a...
Q: Calculate median from the following data: 30-60 60-80 80-90 Marks 0-10 10-30 2 No. of Students 8 5 1...
A:
Q: The XYZ Corporation is interested in possible differences in days worked by salaried employees in th...
A:
Q: 3. Consider the above Frequency Distribution of Salaries. Salary 41,000 - 50,000 51,000 - 60,000 61,...
A: Since you have posted a question with multiple sub-parts, we will solve first three subparts for you...
Q: Analyse the frequency distribution by the method of moments: X: 3 4 f. 1 3 7 S3
A: The moments are used to measure the deviation of data from the arithmetic mean. It used to measure t...
Q: Question 4 Compute for the area between z = ±1.43.
A:
Q: According to a report by the U.S. Fish and Wildlife Service, the mean length of six-year-old rainbow...
A: As per Bartleby guideline expert have to answer first question only dear student please upload other...
Q: A Gallup poll asked a sample of Canadian adults if they thought the law should allow doctors to end ...
A: Givensample size(n)=260x=163p^=xn=163260=0.6269
Q: State the Five Number Summary for the following dataset. 44 45 46 47 49 51 54 55 58...
A:

Step by step
Solved in 3 steps with 3 images

- On snow-covered roads, winter tires enable a car to stop in a shorter distance than if summer tires were installed. In terms of the additive model for one-way ANOVA, and for an experiment in which the mean stopping distances on a snow-covered road are measured for each of four brands of winter tires. If the data are as shown in Sheet 48, what conclusion would be reached at the 0.01 level of significance? Shett 48 Supplier A 517 484 463 452 502 447 481 500 485 566 Supplier B 479 499 488 430 482 457 424 488 526 455 Supplier C 435 443 480 465 435 430 465 514 463 510 Supplier D 526 537 443 505 468 533 481 477 490 470 Select one: a) p-value = 0.28 greater than 0.05, the average distance is different for at list two tires b) F stat = 1.86, F crit = 4.38, not enough evidence to claim that the average distance is different for at list two tires c) F ratio = 4.38, not enough evidence to claim that the average distance is different for at list two tires d) F stat = 0.68, F…A paper investigated the driving behavior of teenagers by observing their vehicles as they left a high school parking lot and then again at a site approximately 1 2 mile from the school. Assume that it is reasonable to regard the teen drivers in this study as representative of the population of teen drivers. MaleDriver FemaleDriver 1.3 -0.3 1.3 0.6 0.9 1.1 2.1 0.7 0.7 1.1 1.3 1.2 3 0.1 1.3 0.9 0.6 0.5 2.1 0.5 (a) Use a .01 level of significance for any hypothesis tests. Data consistent with summary quantities appearing in the paper are given in the table. The measurements represent the difference between the observed vehicle speed and the posted speed limit (in miles per hour) for a sample of male teenage drivers and a sample of female teenage drivers. (Use ?males − ?females. Round your test statistic to two decimal places. Round your degrees of freedom down to the nearest whole number. Round your p-value to three decimal places.) t = df =…A paper investigated the driving behavior of teenagers by observing their vehicles as they left a high school parking lot and then again at a site approximately 1 2 mile from the school. Assume that it is reasonable to regard the teen drivers in this study as representative of the population of teen drivers. MaleDriver FemaleDriver 1.4 -0.2 1.2 0.5 0.9 1.1 2.1 0.7 0.7 1.1 1.3 1.2 3 0.1 1.3 0.9 0.6 0.5 2.1 0.5 (a) Use a .01 level of significance for any hypothesis tests. Data consistent with summary quantities appearing in the paper are given in the table. The measurements represent the difference between the observed vehicle speed and the posted speed limit (in miles per hour) for a sample of male teenage drivers and a sample of female teenage drivers. (Use ?males − ?females. Round your test statistic to two decimal places. Round your degrees of freedom down to the nearest whole number. Round your p-value to three decimal places.) t = df =…
- An MP of one city constituency complained in parliament that his constituency consists of mainly poorly paid workers. His colleagues demanded that he substantiates his claim. Mtuwetu hired a statistician who collected data on monthly salaries from a sample of 500 residents of the constituency. The statistician recorded the following data: Monthly salary (ksh 000) No. of residents 0-5 50 5 – 10 170 10 – 15 210 15 – 20 40 20 – 25 20 25 – 30 10 Suppose ksh 8,000 and 22,000 are the divided salary points of lower, middle, and upper-income groups. What proportion of the constituents fall in each of the income groupsA professor at a large university believes that work-study students work an average of 15 hours each week. A random sample of 24 students from a group of 250 work-study students reported the following number of hours worked in one week. (HINT: Put into L1 and then choose data when constructing the test.) 12 13 14 14 15 15 15 16 16 16 16 16 17 17 17 18 18 18 18 19 19 19 20 21 Does this sample indicate that work-study students are working more hours than the professor believes? Test an appropriate hypothesis and state your conclusion using a significance level of 0.05.Below are the results for the three periods between the USA Stock and the USA Treasuary Bills. The complete sample, January 1950 to December 2017. Correlation = -0.159596558 The subsample, January 1950 to December 1969. Correlation = -0.262086255 The subsample, January 1970 to December 2017. Correlation = -0.142338644 required, interprete the meaning of the results and if the null hypothesis was that the colerration is 0 would that be true?
- To test for any significant difference in the number of hours between breakdowns for four machines, the following data were obtained. Machine1 Machine2 Machine3 Machine4 6.6 8.9 10.9 9.8 8.0 7.5 10.1 12.8 5.7 9.6 9.5 12.0 7.6 10.4 10.2 10.8 8.7 9.5 9.1 11.3 7.8 9.9 9.0 11.1 (a) At the ? = 0.05 level of significance, what is the difference, if any, in the population mean times among the four machines? State the null and alternative hypotheses. H0: At least two of the population means are equal.Ha: At least two of the population means are different.H0: ?1 ≠ ?2 ≠ ?3 ≠ ?4Ha: ?1 = ?2 = ?3 = ?4 H0: ?1 = ?2 = ?3 = ?4Ha: ?1 ≠ ?2 ≠ ?3 ≠ ?4H0: Not all the population means are equal.Ha: ?1 = ?2 = ?3 = ?4H0: ?1 = ?2 = ?3 = ?4Ha: Not all the population means are equal. Find the value of the test statistic. (Round your answer to two decimal places.) Find the p-value. (Round your answer to three decimal places.) p-value = State your conclusion. Do not reject H0. There is…Your research team reads the article that is summarized in Question 2. Your team argues that the research design is flawed and that all participants should have been exposed to both conditions in order to observe a true difference. Your team carries out a similar study, yielding the data below. Participant ID No VR Condition VR Condition _______ 001 21 20 002 23 23 003 19 17 004 22 23 005 24 20 006 22 19 007 23 20 008 23 17 009 21 19 010 20 17 011 22 20 012 19 20 013 18 21 014 23 18 015 21 17 016 20 19 017 19 20 018 24 18 019 25 20 020 22 22 a.) What sort of research design is used in this study? How do you know? b.) What values go in the last column? Write the (very simple) formula used to calculate the last column below and then go…A group of high-risk automobile drivers (with three moving violations in one year) are required, according to random assignment, either to attend a traffic school or to perform supervised volunteer work. During the subsequent five-year period, these same drivers were cited for the following number of moving violations: NUMBER OF MOVING VIOLATIONS TRAFFIC SCHOOL VOLUNTEER WORK 0 26 0 7 15 4 9 1 7 1 0 14 2 6 23 10 7 8 Why might the Mann–Whitney U test be preferred to the t test for these data? Use U to test the null hypothesis at the .05 level of significance. Specify the approximate p-value for this test result.
- To test for any significant difference in the number of hours between breakdowns for four machines, the following data were obtained. Machine1 Machine2 Machine3 Machine4 6.6 8.8 10.9 9.5 7.9 7.3 10.0 12.5 5.5 9.3 9.3 11.9 7.6 10.2 10.0 10.6 8.5 9.2 8.8 11.1 7.1 9.8 8.6 11.0 (a) At the ? = 0.05 level of significance, what is the difference, if any, in the population mean times among the four machines? State the null and alternative hypotheses. -H0: Not all the population means are equal.Ha: ?1 = ?2 = ?3 = ?4 -H0: ?1 ≠ ?2 ≠ ?3 ≠ ?4Ha: ?1 = ?2 = ?3 = ?4 -H0: At least two of the population means are equal.Ha: At least two of the population means are different. -H0: ?1 = ?2 = ?3 = ?4Ha: Not all the population means are equal. -H0: ?1 = ?2 = ?3 = ?4Ha: ?1 ≠ ?2 ≠ ?3 ≠ ?4 Find the value of the test statistic. (Round your answer to two decimal places.) Statistic=?? Find the p-value. (Round your answer to three decimal places.) p-value = ?? State your conclusion. Do…A professor at a large university believes that work-study students work an average of 15 hours each week. A random sample of 24 students from a group of 250 work-study students reported the following number of hours worked in one week. (HINT: Put into L1 and then choose data when constructing the test.)12 13 14 14 15 15 15 16 16 16 16 1617 17 17 18 18 18 18 19 19 19 20 21Does this sample indicate that work-study students are working more hours than the professor believes? Test an appropriate hypothesis and state your conclusion.In a study conducted to investigate browsing activity by shoppers, each shopper was initially classified as a nonbrowser, light browser, or heavy browser. For each shopper, the study obtained a measure to determine how comfortable the shopper was in a store. Higher scores indicated greater comfort. Suppose the following data were collected. Light Heavy Nonbrowser Browser Browser 10 9 7 11 10 9 12 9 7 9 8 9 9 11 6 10 8 8 11 10 7 10 9 9 . Use to test for a difference among mean comfort scores for the three types of browsers. Compute the values identified below (to 2 decimals, if necessary). Sum of Squares, Treatment Sum of Squares, Error Mean Squares, Treatment Mean Squares, Error Calculate the value of the test statistic (to 2 decimals, if necessary). The -value is - Select your answer -less than .01between .01 and .025between .025 and .05between .05 and .10greater than .10Item 6 What is your…