A math teacher claims that she has developed a review course that increases the scores of students on the math portion of a college entrance exam. Based on data from the administrator of the exam, scores are normally distributed with µ = 519. The teacher obtains a random sample of 1800 students, puts them through the review class, and finds that the mean math score of the 1800 students is 526 with a standard deviation of 119. Complete parts (a) through (d) below. (b) Test the hypothesis at the a = 0.10 level of significance. Is a mean math score of 526 statistically significantly higher than 519? Conduct a hypothesis test using the P-value approach. Find the test statistic. to =0 (Round to two decimal places as needed.)
A math teacher claims that she has developed a review course that increases the scores of students on the math portion of a college entrance exam. Based on data from the administrator of the exam, scores are normally distributed with µ = 519. The teacher obtains a random sample of 1800 students, puts them through the review class, and finds that the mean math score of the 1800 students is 526 with a standard deviation of 119. Complete parts (a) through (d) below. (b) Test the hypothesis at the a = 0.10 level of significance. Is a mean math score of 526 statistically significantly higher than 519? Conduct a hypothesis test using the P-value approach. Find the test statistic. to =0 (Round to two decimal places as needed.)

MATLAB: An Introduction with Applications
6th Edition
ISBN:9781119256830
Author:Amos Gilat
Publisher:Amos Gilat
Chapter1: Starting With Matlab
Section: Chapter Questions
Problem 1P

Related questions
Question
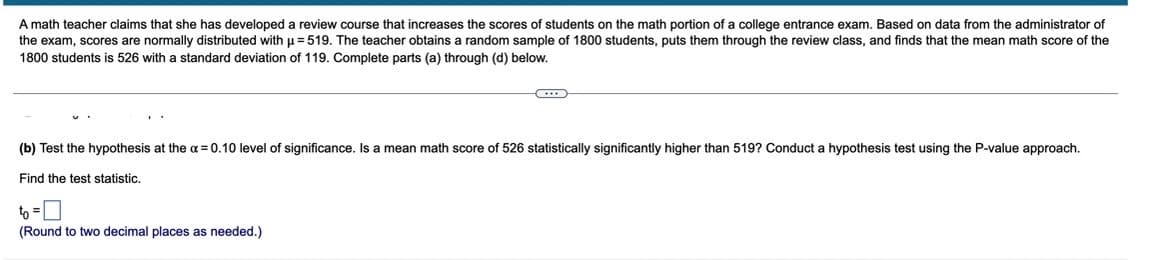
Transcribed Image Text:A math teacher claims that she has developed a review course that increases the scores of students on the math portion of a college entrance exam. Based on data from the administrator of
the exam, scores are normally distributed with u = 519. The teacher obtains a random sample of 1800 students, puts them through the review class, and finds that the mean math score of the
1800 students is 526 with a standard deviation of 119. Complete parts (a) through (d) below.
(b) Test the hypothesis at the a = 0.10 level of significance. Is a mean math score of 526 statistically significantly higher than 519? Conduct a hypothesis test using the P-value approach.
Find the test statistic.
to =
(Round to two decimal places as needed.)
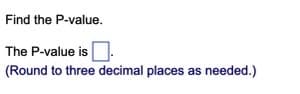
Transcribed Image Text:Find the P-value.
The P-value is.
(Round to three decimal places as needed.)
Expert Solution
This question has been solved!
Explore an expertly crafted, step-by-step solution for a thorough understanding of key concepts.

Step by step
Solved in 2 steps with 1 images

Recommended textbooks for you
MATLAB: An Introduction with Applications
Statistics
ISBN:
9781119256830
Author:
Amos Gilat
Publisher:
John Wiley & Sons Inc

Probability and Statistics for Engineering and th…
Statistics
ISBN:
9781305251809
Author:
Jay L. Devore
Publisher:
Cengage Learning

Statistics for The Behavioral Sciences (MindTap C…
Statistics
ISBN:
9781305504912
Author:
Frederick J Gravetter, Larry B. Wallnau
Publisher:
Cengage Learning
MATLAB: An Introduction with Applications
Statistics
ISBN:
9781119256830
Author:
Amos Gilat
Publisher:
John Wiley & Sons Inc
Probability and Statistics for Engineering and th…
Statistics
ISBN:
9781305251809
Author:
Jay L. Devore
Publisher:
Cengage Learning
Statistics for The Behavioral Sciences (MindTap C…
Statistics
ISBN:
9781305504912
Author:
Frederick J Gravetter, Larry B. Wallnau
Publisher:
Cengage Learning

Elementary Statistics: Picturing the World (7th E…
Statistics
ISBN:
9780134683416
Author:
Ron Larson, Betsy Farber
Publisher:
PEARSON

The Basic Practice of Statistics
Statistics
ISBN:
9781319042578
Author:
David S. Moore, William I. Notz, Michael A. Fligner
Publisher:
W. H. Freeman

Introduction to the Practice of Statistics
Statistics
ISBN:
9781319013387
Author:
David S. Moore, George P. McCabe, Bruce A. Craig
Publisher:
W. H. Freeman