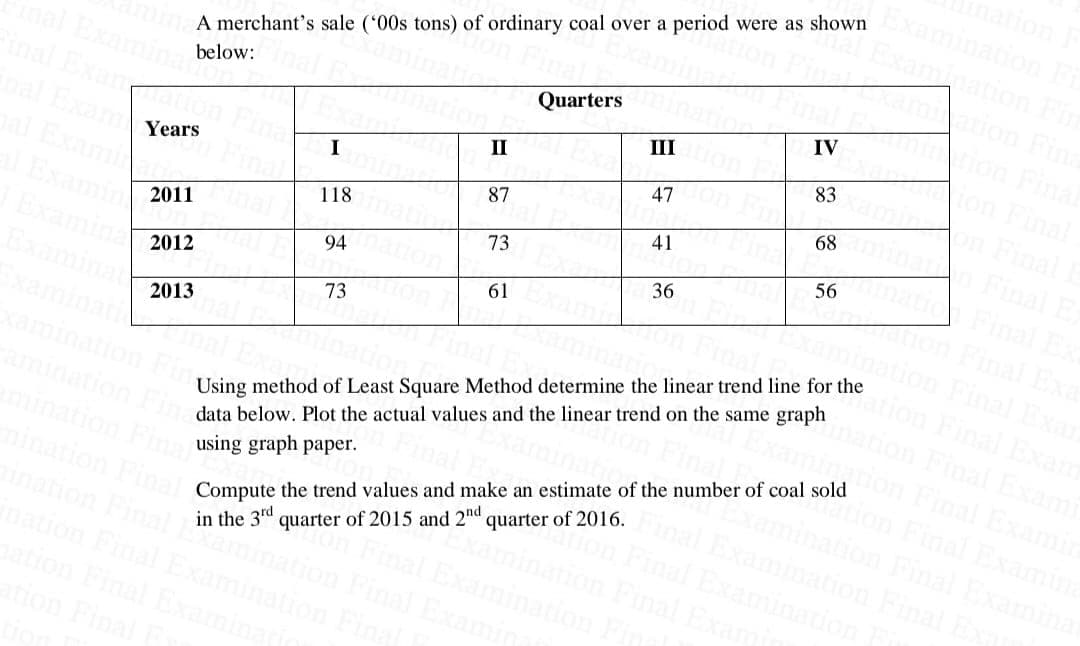
A merchant's sale (*00s tons) of ordinary coal over a period were as shown below: Quarters Years I II III IV 2011 118 87 47 83 2012 94 73 41 68 2013 73 61 36 56 Using method of Least Square Method determine the linear trend line for the data below. Plot the actual values and the linear trend on the same graph


Q: For the data set 2 20 11 26 10 5 6. 15 13 19 12 10 3 17 24 27 23 18 12 9. 26 31 10 The 67th…
A:
Q: An upward sloping linear trend line through a scatter plot indicates a a) postive mean b)…
A: An upward sloping linear trend line through a scatter plot indicates a
Q: 5. Which of the following is the most appropriate measure of central tendency for nominal data? (A)…
A: The mode is the measure which gives the most frequent value and nominal data is the type of data…
Q: 9. Does this scatter plot show a positive association, negative association, or no association?…
A: As per bartleby guideline for more than one question asked only first is to be answered please…
Q: Calculate the indices of seasonal variation by ratio to trend method from the following data. Year…
A: Year Quarter y 4 figures moving total 4 figures moving average 2 figures moving total 2 figures…
Q: To measure the relationship between emotional intelligence and marital satisfaction, a psychologist…
A:
Q: The following table presents the scores of students in Statistics examination Scores Frequency 30-39…
A: Solution Mode of the data lies between the 70 -79 because this class has highest frequency.
Q: The following table gives the quarterly sales of the Coca-Cola Company. What is a moving average…
A: Moving average method is a time series analysis method in which data points are analyzed by taking…
Q: . The share prices of a company in Mumbai and Kolkatta markets during the last 10 months are…
A: To perform the two tail test for theequlatiy of mean of the number of viewers of movies and that of…
Q: Suppose an Internet retailer would like to investigate the linear relationship between the amount of…
A:
Q: Listed below are PSAT scores and SAT scores from prospective college applicants. The scores were…
A: PSAT(x) SAT(y) xy x2 y2 183 2200 402600 33489 4840000 207 2040 422280 42849 4161600 167…
Q: The following data is based on the monthly fees paid by 50 internet users in the year 2000. 8 9 10…
A: There are 50 observations. That is n = 50 1. In a stem and leaf display, the digit in the greatest…
Q: 5. In a carbon dioxide emission test center for automobiles, a sample of 20 days showed the…
A: 5. In a carbon dioxide emission test center for automobiles, a sample of 20 days showed the…
Q: Three yearly moving averages for the given data are
A: Since the period of moving averages is m = 3, then we take the average of three observations at a…
Q: If you have assessed the college majors and happiness levels of a sample of people and the data…
A: Given: If you have assessed the college majors and happiness levels of a sample of people and the…
Q: 11. Mrs. Moises, the school counselor, keeps a candy jar in her office for students. During one…
A: Given that, The graph of a trend line is given as follows,
Q: Fit a trend line to the following data by the method of least square. 1988 1990 1992 1994 1996 1998…
A:
Q: data Colombia 87 36 36 84 91 61 61 76 85 87 57 61 61 39 22 3 44 36 22 36 33…
A: According to our guidelines we can answer only one question at a time. Kindly re-post the other…
Q: From the data given below determine the line of trend and hence find the expected value for 1986.
A: Here use regression line formula
Q: 3. The relationship of the variables in a scatter plot is described in terms of its A. shape, trend,…
A: In a scatterplot, we describe the overall pattern with descriptions of direction, form, and…
Q: vt 14. Calculate trend values by the method of Least Square from the data given below 4. and…
A:
Q: Below are given the annual production (in '000 Rs.) of a fertiliser factory : 1998 100 1997 Year :…
A:
Q: 1. Give below is the data on production of a company (in lakhs). Year: 1983 1984 1985 1986 1987 1988…
A:
Q: How much is a college degree worth? The 2010 annual salaries in dollars for a random sample of…
A: Correlation coefficient measures the strength and direction of the linear relationship between two…
Q: A local judge has been allowing some individuals convicted of “driving under the influence” to work…
A:
Q: The demand for bottled water increases during the hurricane season in Florida. The number of…
A: Measures of Central Tendency: A measure of central tendency represents the central value or typical…
Q: Which data set graphed below would most likely consider the MODE as the best measure of central…
A:
Q: Oscars Listed below are ages of Oscar winners matched by the years in which the awards were won…
A:
Q: Manatees Listed below are numbers of registered pleasure boats in Florida (tens of thousands) and…
A: Given information can be used to calculate the following:
Q: An insurance company keeps a record of insurance plans sold per day for the past 150 days, as…
A: Solution: x =Number of Insurance plans sold per day f= Frequency of occurance x (f) x2 fx fx2…
Q: Create a stem and leaf display of these data 184 98 101 126 150 166 82 136 124 118 133 83 86 101…
A: Given data: 82, 83, 86, 88, 97, 98, 101, 101, 105, 106, 118, 124, 126, 128, 131, 133, 136, 150, 166,…
Q: Which of these does not constitute a descriptive statistic? A. 'A table of raw data in a…
A: Descriptive statistics is summarization of characteristics of the data set.
Q: Three yearly moving averages for the given data are Year Progress 1990 121 1991 115 1992 133 1993…
A: The given data is on year and progress, It is been asked to calculate three yearly moving averages.…
Q: Find seasonal variations by the ratio-to-trend method from the data given below: 1st Quarter Year…
A:
Q: The number of days travelers purchase their airline tickets ahead of their flights can be modeled by…
A:
Q: How much is a college degree worth? The 2010 annual salaries in dollars for a random sample of…
A: Hey, since there are multiple questions posted, we will answer first question. If you want any…
Q: Also Fit a trend line to the following data by the method of semi averages. draw the curve for both…
A:
Q: Without graphing, determine if the following data set is exactly linear, y 1 7 9 11 13 Is the data…
A:
Q: Feb. Mar. Apr. May June July Sept. Aug 8.2 Oct. Store 1 Store 2 6.3 6.5 7.0 6.7 7.6 7.9 7.7 8.4 8.2…
A: Given data :
Q: Given data points (2. -1). (2, 1). (3, 2). (0,- 1)and (3, -1). find the total variance of the data.
A: Given: Data : (2 , -1 ) , (2 , 1 ) , (3 , 2) , (0 , -1), (3,-1)
Q: The state Department of Education has rated a sample of local school systems for compliance with…
A:
Q: The following data give the 2009 estimates of crude oil reserves (in billions of barrels) of Saudi…
A: We write the data in graphical forms such as scatterplot, boxplot, etc, etc. In the box plot, we can…
Q: 4. Which of the following factors has the highest positive correlation with life expectancy in some…
A: The correlation coefficient is denoted by R. It is used to measure how strong a…
Q: Use the method of least square to fit a trend line for the income from the following data. Estimate…
A:
Q: From the following table find the correlation between age and playing habit: Age No. of Students…
A: Let X be the number of students Y be the regular player X: 200,270,340,360,400,200 Y:…
Q: A sample of 20 financial analysts was asked to provide forecasts of earnings per share of a…
A: Hey there! Thank you for posting the question.Since you have posted a question with multiple…
Q: Oscars Listed below are ages of Oscar winners matched by the years in which the awards were won…
A: The t-test for correlation coefficient will use to conclude if there is a linear correlation between…
Q: Suppose Burger King has run a major advertising campaign in the hopes of increasing monthly sales.…
A: To find: The mean of the matched-pair differences

Step by step
Solved in 3 steps with 3 images

- A researcher designs an experiment using two drugs, she prepares 15 independent flasks of yeast growth medium and yeast cells. She adds tunicamycin (T) or caffeine (C) to 5 flasks each. Remaining 5 flasks get no drugs (ND). Doubling time of the yeast cells are measured in each flask,data is provided below: a. Test if mean doubling time is different in Caffeine (C ) when compared to no drug (ND) using an ANOVA method, report an approximate p-value for the level of significance.b. If a drug decreases the doubling time of yeast cells, what could be the purpose of using this drug?Two suppliers manufacture a plastic gear used in a laser printer. The impact strength of these gears measured in foot-pounds is an important characteristic. A random sample of 10 gears from supplier 1 results in x1 = 290 and s1 = 12, and another random sample of 16 gears from the second supplier results in x2 = 310 and s2 = 22. Do the data support the claim that the mean impact strength of gears from supplier 2 is at least 10 foot-pounds higher than that of supplier 1, find the tcalc value? Please report your answer upto 3 decimal places.(c) Predict the final grade for a student who misses five class periods and compute the residual. Is the observed final grade above or below average for this number of absences?
- An analysis was conducted by the Statistics Consulting Center atVirginia Polytechnic Institute and State University in which acertain treatment was applied to a set of tree stumps. The chemicalGarlon was used the with the purpose of regenerating the roots ofthe stumps. A spray was used with four levels of GarlonPage 23 of 23concentration. After a period of time the height of the shoots wasobserved. Does the concentration of Garlon has a significantimpact on the height of the shoots? Use α = 0.05.the american association of individual investors conducts a weekly survey of its members to measure the percent who are bullish, bearish, and neutral on the stock market for thenext six months. for the week ending november 7, 2012, the survey results showed 38.5%bullish, 21.6% neutral, and 39.9% bearish (aaii website, november 12, 2012). assumethese results are based on a sample of 300 aaii members.a. over the long term, the proportion of bullish aaii members is .39. conduct a hypothesis test at the 5% level of significance to see if the current sample results show thatbullish sentiment differs from its long term average of .39. what are your findings?the american association of individual investors conducts a weekly survey of its members to measure the percent who are bullish, bearish, and neutral on the stock market for thenext six months. for the week ending november 7, 2012, the survey results showed 38.5%bullish, 21.6% neutral, and 39.9% bearish (aaii website, november 12, 2012). assumethese results are based on a sample of 300 aaii members.a. over the long term, the proportion of bullish aaii members is .39. conduct a hypothesis test at the 5% level of significance to see if the current sample results show thatbullish sentiment differs from its long term average of .39. what are your findings?b. over the long term, the proportion of bearish aaii members is .30. conduct a hypothesis test at the 1% level of significance to see if the current sample results show thatbearish sentiment is above its long term average of .30. what are your findings?
- the american association of individual investors conducts a weekly survey of its members to measure the percent who are bullish, bearish, and neutral on the stock market for thenext six months. for the week ending november 7, 2012, the survey results showed 38.5%bullish, 21.6% neutral, and 39.9% bearish (aaii website, november 12, 2012). assumethese results are based on a sample of 300 aaii members.a. over the long term, the proportion of bullish aaii members is .39. conduct a hypothesis test at the 5% level of significance to see if the current sample results show thatbullish sentiment differs from its long term average of .39. what are your findings?b. over the long term, the proportion of bearish aaii members is .30. conduct a hypothesis test at the 1% level of significance to see if the current sample results show thatbearish sentiment is above its long term average of .30. what are your findings?c. would you feel comfortable extending these results to all investors? why or why…What is the kurtosis for a distribution with a mean of 12.00 and a mode of 12.00?The length of time from the initial exposure to HIV infection to the diagnosis of AIDS is termed as the incubation period. An arbitrary dataset for the incubation period of a random selection of 8 HIV infected patients is presented in the table below: Incubation period (in years) 12.5 10.0 14.0 7.7 11.0 6.8 13.0 10.8 Compute the appropriate measure(s) of central tendency and address its worthiness. Calculate the measure(s) of dispersion and discuss which measure is the most appropriate one and why? What will happen to the sample mean, median, standard deviation if a particular data point 6.8 above has adjusted to 1.5? Discuss whether it will increase, decrease, or remain the same.