A Michigan study concerning preference for outdoor activities used a questionnaire with a six-point Likert-type response in which 1 designated "not important" and 6 designated "extremely important." A random sample of n1 = 44 adults were asked about fishing as an outdoor activity. The mean response was x1 = 4.9. Another random sample of n2 = 49 adults were asked about camping as an outdoor activity. For this group, the mean response was x2 = 4.1. From previous studies, it is known that ?1 = 1.5 and ?2 = 2.0. Does this indicate a difference (either way) regarding preference for camping versus preference for fishing as an outdoor activity? Use a 5% level of significance. Note: A Likert scale usually has to do with approval of or agreement with a statement in a questionnaire. For example, respondents are asked to indicate whether they "strongly agree," "agree," "disagree," or "strongly disagree" with the statement.
A Michigan study concerning preference for outdoor activities used a questionnaire with a six-point Likert-type response in which 1 designated "not important" and 6 designated "extremely important." A random sample of n1 = 44 adults were asked about fishing as an outdoor activity. The mean response was x1 = 4.9. Another random sample of n2 = 49 adults were asked about camping as an outdoor activity. For this group, the mean response was x2 = 4.1. From previous studies, it is known that ?1 = 1.5 and ?2 = 2.0. Does this indicate a difference (either way) regarding preference for camping versus preference for fishing as an outdoor activity? Use a 5% level of significance. Note: A Likert scale usually has to do with approval of or agreement with a statement in a questionnaire. For example, respondents are asked to indicate whether they "strongly agree," "agree," "disagree," or "strongly disagree" with the statement.
A Michigan study concerning preference for outdoor activities used a questionnaire with a six-point Likert-type response in which 1 designated "not important" and 6 designated "extremely important." A random sample of n1 = 44 adults were asked about fishing as an outdoor activity. The mean response was x1 = 4.9. Another random sample of n2 = 49 adults were asked about camping as an outdoor activity. For this group, the mean response was x2 = 4.1. From previous studies, it is known that ?1 = 1.5 and ?2 = 2.0. Does this indicate a difference (either way) regarding preference for camping versus preference for fishing as an outdoor activity? Use a 5% level of significance. Note: A Likert scale usually has to do with approval of or agreement with a statement in a questionnaire. For example, respondents are asked to indicate whether they "strongly agree," "agree," "disagree," or "strongly disagree" with the statement.
A Michigan study concerning preference for outdoor activities used a questionnaire with a six-point Likert-type response in which 1 designated "not important" and 6 designated "extremely important." A random sample of n1 = 44 adults were asked about fishing as an outdoor activity. The mean response was x1 = 4.9. Another random sample of n2 = 49 adults were asked about camping as an outdoor activity. For this group, the mean response was x2 = 4.1. From previous studies, it is known that ?1 = 1.5 and ?2 = 2.0. Does this indicate a difference (either way) regarding preference for camping versus preference for fishing as an outdoor activity? Use a 5% level of significance. Note: A Likert scale usually has to do with approval of or agreement with a statement in a questionnaire. For example, respondents are asked to indicate whether they "strongly agree," "agree," "disagree," or "strongly disagree" with the statement.
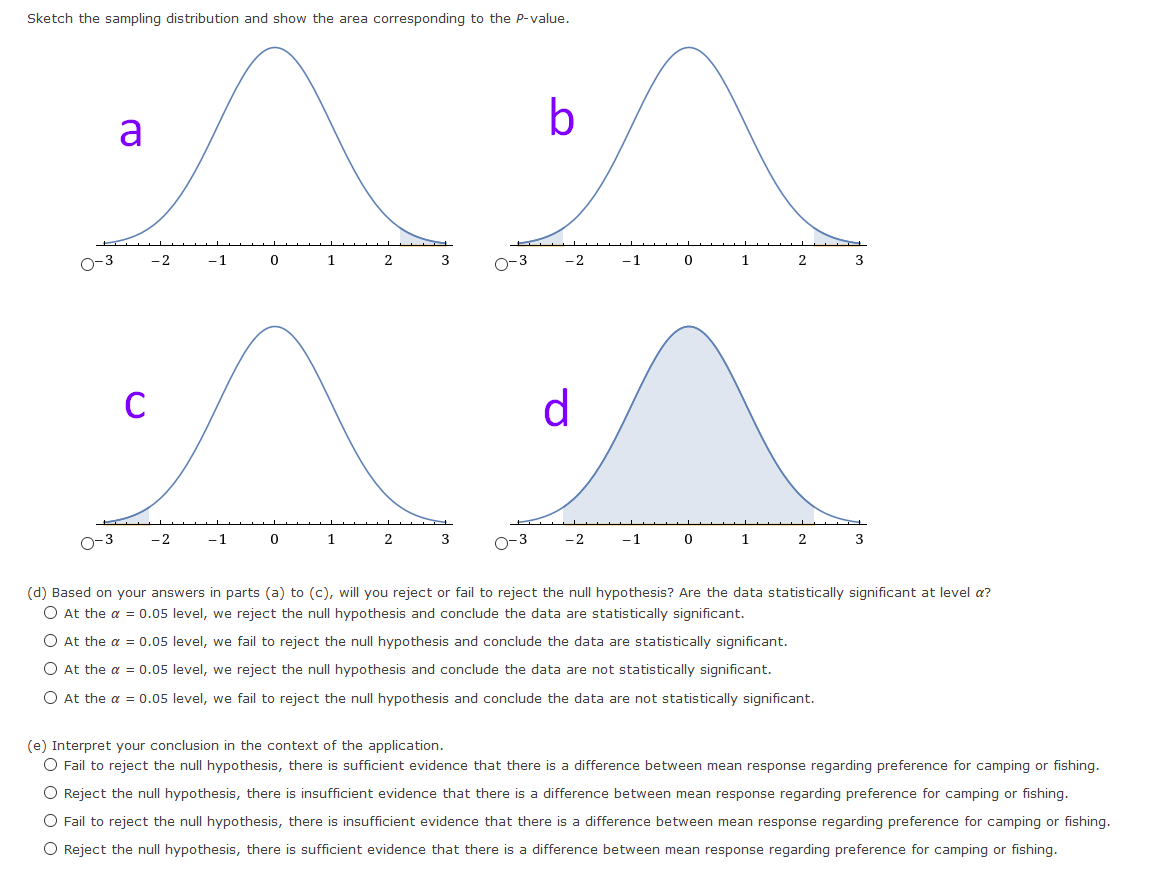
Transcribed Image Text:Sketch the sampling distribution and show the area corresponding to the P-value.
b
a
-2
-1
O-3
-2
-1
1.
C
d.
-2
- 1
1
2
O-3
-2
-1
1
2
3
(d) Based on your answers in parts (a) to (c), will you reject or fail to reject the null hypothesis? Are the data statistically significant at level a?
O At the a = 0.05 level, we reject the null hypothesis and conclude the data are statistically significant.
O At the a = 0.05 level, we fail to reject the null hypothesis and conclude the data are statistically significant.
O At the a = 0.05 level, we reject the null hypothesis and conclude the data are not statistically significant.
O At the a = 0.05 level, we fail to reject the null hypothesis and conclude the data are not statistically significant.
(e) Interpret your conclusion in the context of the application.
O Fail to reject the null hypothesis, there is sufficient evidence that there is a difference between mean response regarding preference for camping or fishing.
O Reject the null hypothesis, there is insufficient evidence that there is a difference between mean response regarding preference for camping or fishing.
O Fail to reject the null hypothesis, there is insufficient evidence that there is a difference between mean response regarding preference for camping or fishing.
O Reject the null hypothesis, there is sufficient evidence that there is a difference between mean response regarding preference for camping or fishing.
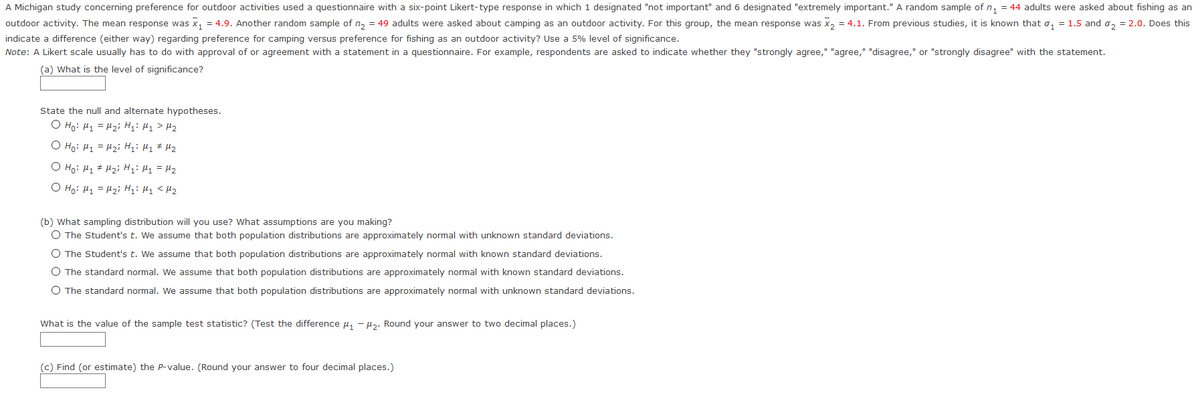
Transcribed Image Text:A Michigan study concerning preference for outdoor activities used a questionnaire with a six-point Likert-type response in which 1 designated "not important" and 6 designated "extremely important." A random sample of n, = 44 adults were asked about fishing as an
outdoor activity. The mean response was x, = 4.9. Another random sample of n, = 49 adults were asked about camping as an outdoor activity. For this group, the mean response was x, = 4.1. From previous studies, it is known that o, = 1.5 and o, = 2.0. Does this
indicate a difference (either way) regarding preference for camping versus preference for fishing as an outdoor activity? Use a 5% level of significance.
Note: A Likert scale usually has to do with approval of or agreement with a statement in a questionnaire. For example, respondents are asked to indicate whether they "strongly agree," "agree," "disagree," or "strongly disagree" with the statement.
(a) What is the level of significance?
State the null and alternate hypotheses.
O Ho: H1 = H2i H;: H1 > H2
O Ho: H1 = H2i H;: H1 # Hz
O Ho: H1 # Hzi H: Hy = H2
O Ho: H1 = H2i Hi: H1 <Hz
(b) What sampling distribution will you use? What assumptions are you making?
O The Student's t. We assume that both population distributions are approximately normal with unknown standard deviations.
O The Student's t. We assume that both population distributions are approximately normal with known standard deviations.
O The standard normal. We assume that both population distributions are approximately normal with known standard deviations.
O The standard normal. We assume that both population distributions are approximately normal with unknown standard deviations.
What is the value of the sample test statistic? (Test the difference u, - µz. Round your answer to two decimal places.)
(c) Find (or estimate) the P-value. (Round your answer to four decimal places.)
Expert Solution
This question has been solved!
Explore an expertly crafted, step-by-step solution for a thorough understanding of key concepts.
Need a deep-dive on the concept behind this application? Look no further. Learn more about this topic, statistics and related others by exploring similar questions and additional content below.