A mock CAASPP (California Assessment of Student Performance and Progress) exam w given to 1000 high school students in a school district. The graph below is the cumulat frequency graph of the results. Which of the following is closest to the five-number summary for the distribution of CAASPP scores? Cumulative Frequency 1000 800 600 400 200 0 10 20 30 40 50 60 Test Scores 70 80 90 100
A mock CAASPP (California Assessment of Student Performance and Progress) exam w given to 1000 high school students in a school district. The graph below is the cumulat frequency graph of the results. Which of the following is closest to the five-number summary for the distribution of CAASPP scores? Cumulative Frequency 1000 800 600 400 200 0 10 20 30 40 50 60 Test Scores 70 80 90 100

Glencoe Algebra 1, Student Edition, 9780079039897, 0079039898, 2018
18th Edition
ISBN:9780079039897
Author:Carter
Publisher:Carter
Chapter10: Statistics
Section10.6: Summarizing Categorical Data
Problem 10CYU

Related questions
Question
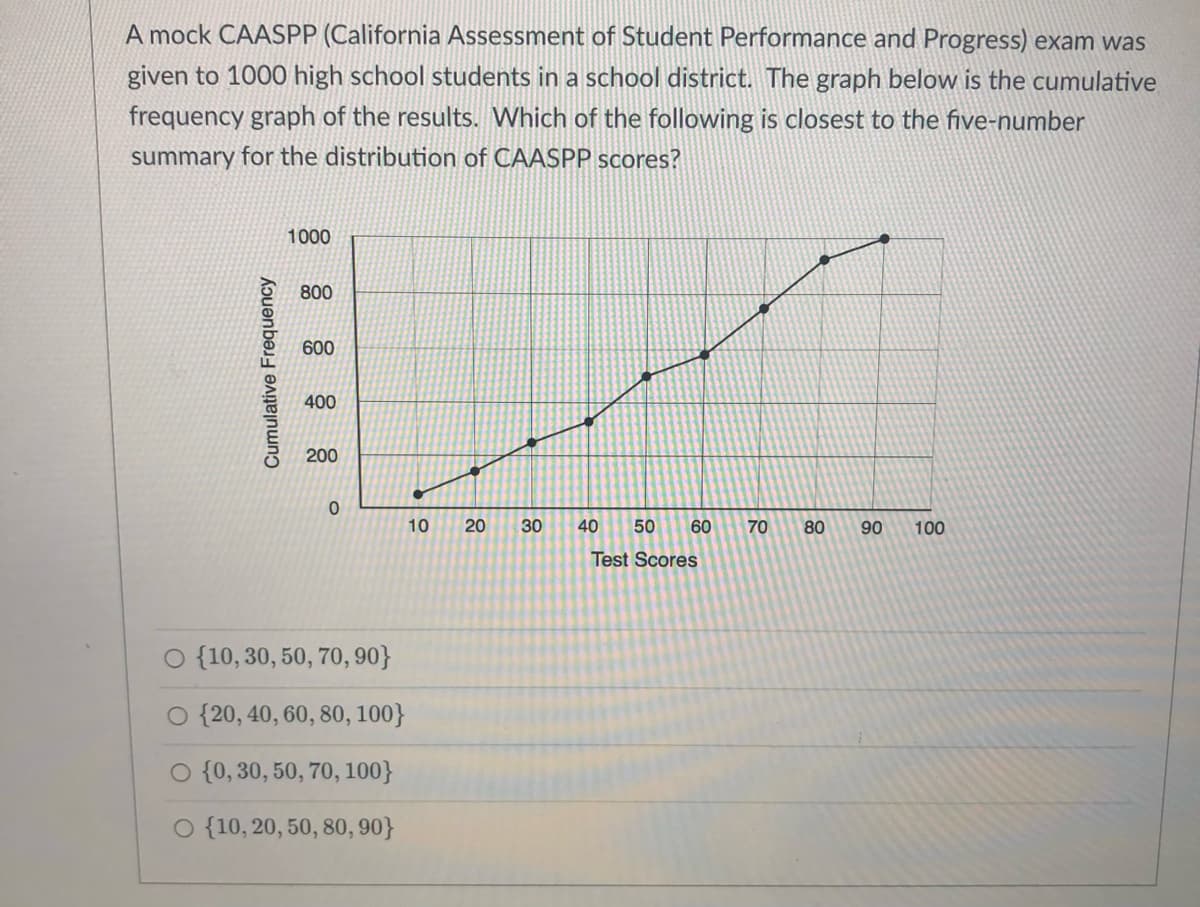
Transcribed Image Text:A mock CAASPP (California Assessment of Student Performance and Progress) exam was
given to 1000 high school students in a school district. The graph below is the cumulative
frequency graph of the results. Which of the following is closest to the five-number
summary for the distribution of CAASPP scores?
Cumulative Frequency
1000
800
600
400
200
0
O {10, 30, 50, 70, 90}
O {20, 40, 60, 80, 100}
O {0, 30, 50, 70, 100}
O {10, 20, 50, 80, 90}
10
20
30
40 50
60
Test Scores
70 80 90 100
Expert Solution
This question has been solved!
Explore an expertly crafted, step-by-step solution for a thorough understanding of key concepts.

This is a popular solution!

Trending now
This is a popular solution!

Step by step
Solved in 2 steps

Recommended textbooks for you
Glencoe Algebra 1, Student Edition, 9780079039897…
Algebra
ISBN:
9780079039897
Author:
Carter
Publisher:
McGraw Hill
Glencoe Algebra 1, Student Edition, 9780079039897…
Algebra
ISBN:
9780079039897
Author:
Carter
Publisher:
McGraw Hill