A model is built to explain the evolution of spending on tourism and recreation in a certain group of families (Y in USD/person/year). As potential explanatory variables are considered: X, – average annual income per person in the family (in USD), X2 – number of people in the family,
A model is built to explain the evolution of spending on tourism and recreation in a certain group of families (Y in USD/person/year). As potential explanatory variables are considered: X, – average annual income per person in the family (in USD), X2 – number of people in the family,

College Algebra
7th Edition
ISBN:9781305115545
Author:James Stewart, Lothar Redlin, Saleem Watson
Publisher:James Stewart, Lothar Redlin, Saleem Watson
Chapter1: Equations And Graphs
Section: Chapter Questions
Problem 10T: Olympic Pole Vault The graph in Figure 7 indicates that in recent years the winning Olympic men’s...

Related questions
Question
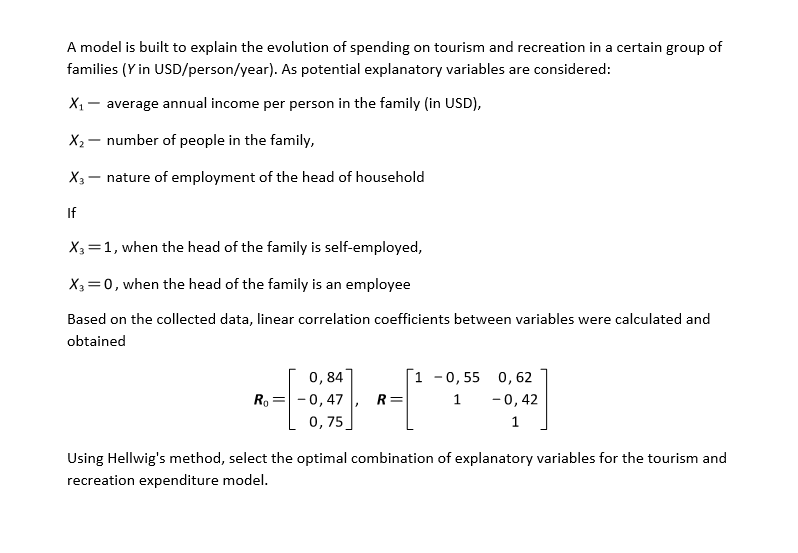
Transcribed Image Text:A model is built to explain the evolution of spending on tourism and recreation in a certain group of
families (Y in USD/person/year). As potential explanatory variables are considered:
X1
average annual income per person in the family (in USD),
X2 – number of people in the family,
X3 – nature of employment of the head of household
If
X3=1, when the head of the family is self-employed,
X3=0, when the head of the family is an employee
Based on the collected data, linear correlation coefficients between variables were calculated and
obtained
0,84
R, = -0,47
[1 -0,55 0, 62
R=
1
-0,42
0,75
1
Using Hellwig's method, select the optimal combination of explanatory variables for the tourism and
recreation expenditure model.
Expert Solution
This question has been solved!
Explore an expertly crafted, step-by-step solution for a thorough understanding of key concepts.

Step by step
Solved in 2 steps

Recommended textbooks for you
College Algebra
Algebra
ISBN:
9781305115545
Author:
James Stewart, Lothar Redlin, Saleem Watson
Publisher:
Cengage Learning

Algebra & Trigonometry with Analytic Geometry
Algebra
ISBN:
9781133382119
Author:
Swokowski
Publisher:
Cengage

Trigonometry (MindTap Course List)
Trigonometry
ISBN:
9781305652224
Author:
Charles P. McKeague, Mark D. Turner
Publisher:
Cengage Learning
College Algebra
Algebra
ISBN:
9781305115545
Author:
James Stewart, Lothar Redlin, Saleem Watson
Publisher:
Cengage Learning
Algebra & Trigonometry with Analytic Geometry
Algebra
ISBN:
9781133382119
Author:
Swokowski
Publisher:
Cengage
Trigonometry (MindTap Course List)
Trigonometry
ISBN:
9781305652224
Author:
Charles P. McKeague, Mark D. Turner
Publisher:
Cengage Learning

Trigonometry (MindTap Course List)
Trigonometry
ISBN:
9781337278461
Author:
Ron Larson
Publisher:
Cengage Learning