A movement along the demand curve, represented by points A and B, is shown in the diagram to the right. Point A (30, 70) is the initial point, and point B (40, 60) is the point after the price change.
A movement along the demand curve, represented by points A and B, is shown in the diagram to the right. Point A (30, 70) is the initial point, and point B (40, 60) is the point after the price change.

Chapter5: Elasticity Of Demand And Supply
Section: Chapter Questions
Problem 1.1P: (Calculating Price Elasticity of Demand) Suppose that 50 units of a good are demanded at a price of...

Related questions
Question
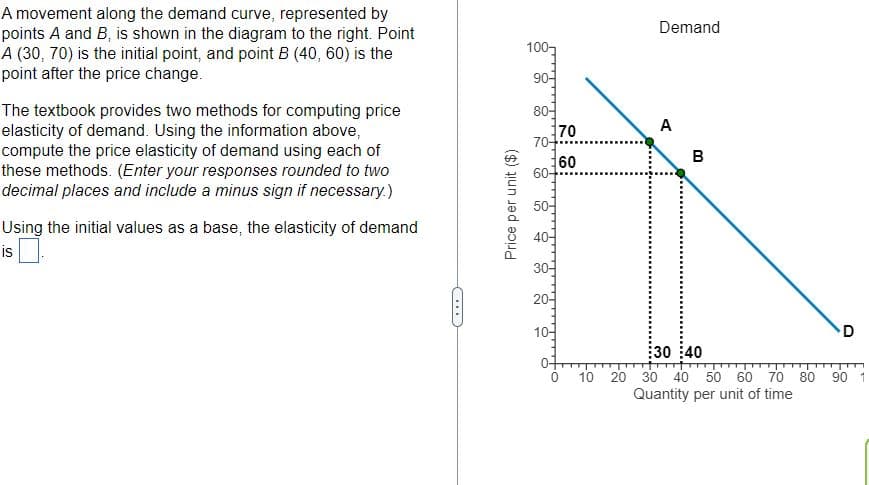
Transcribed Image Text:A movement along the demand curve, represented by
points A and B, is shown in the diagram to the right. Point
A (30, 70) is the initial point, and point B (40, 60) is the
point after the price change.
The textbook provides two methods for computing price
elasticity of demand. Using the information above,
compute the price elasticity of demand using each of
these methods. (Enter your responses rounded to two
decimal places and include a minus sign if necessary.)
Using the initial values as a base, the elasticity of demand
is
C...
Price per unit ($)
1007
90-
80-
70-
60-
50-
8 8 8
40-
30-
20-
10-
70
60
0
Demand
A
00
B
:30 40
10 20 30 40 50 60 70
Quantity per unit of time
80
D
90 1
Expert Solution
This question has been solved!
Explore an expertly crafted, step-by-step solution for a thorough understanding of key concepts.

This is a popular solution!

Trending now
This is a popular solution!

Step by step
Solved in 2 steps with 1 images

Knowledge Booster


Learn more about
Need a deep-dive on the concept behind this application? Look no further. Learn more about this topic, economics and related others by exploring similar questions and additional content below.Recommended textbooks for you


