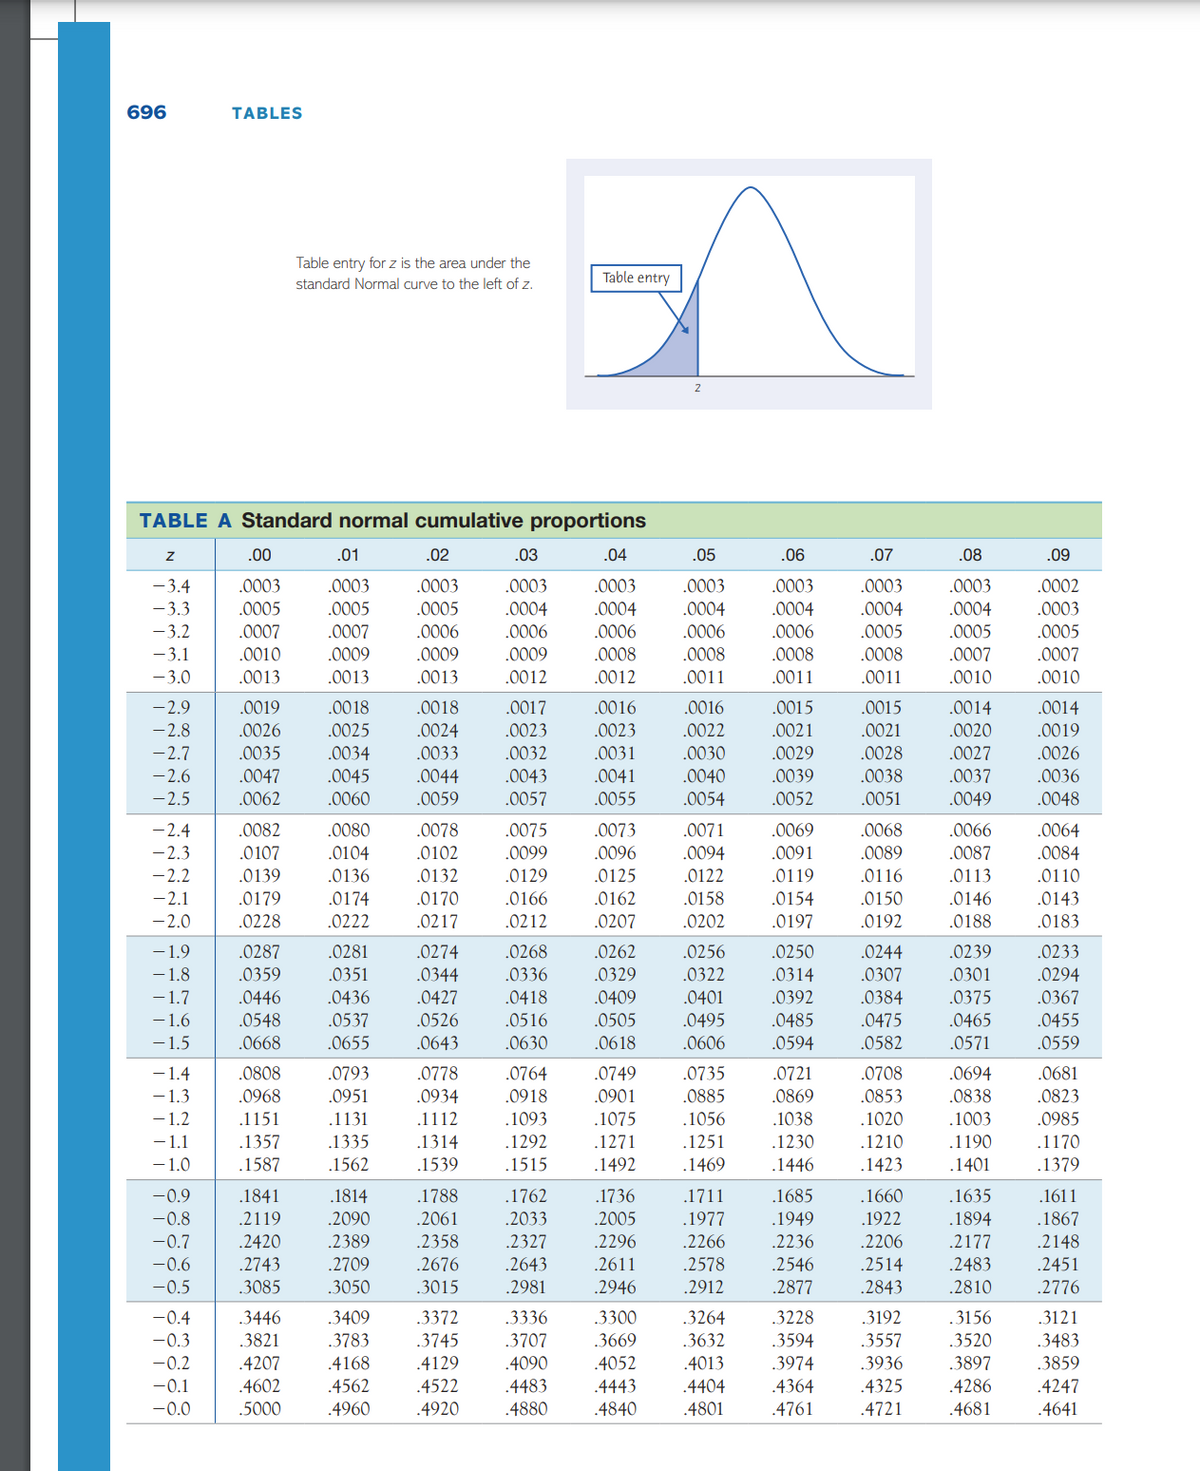
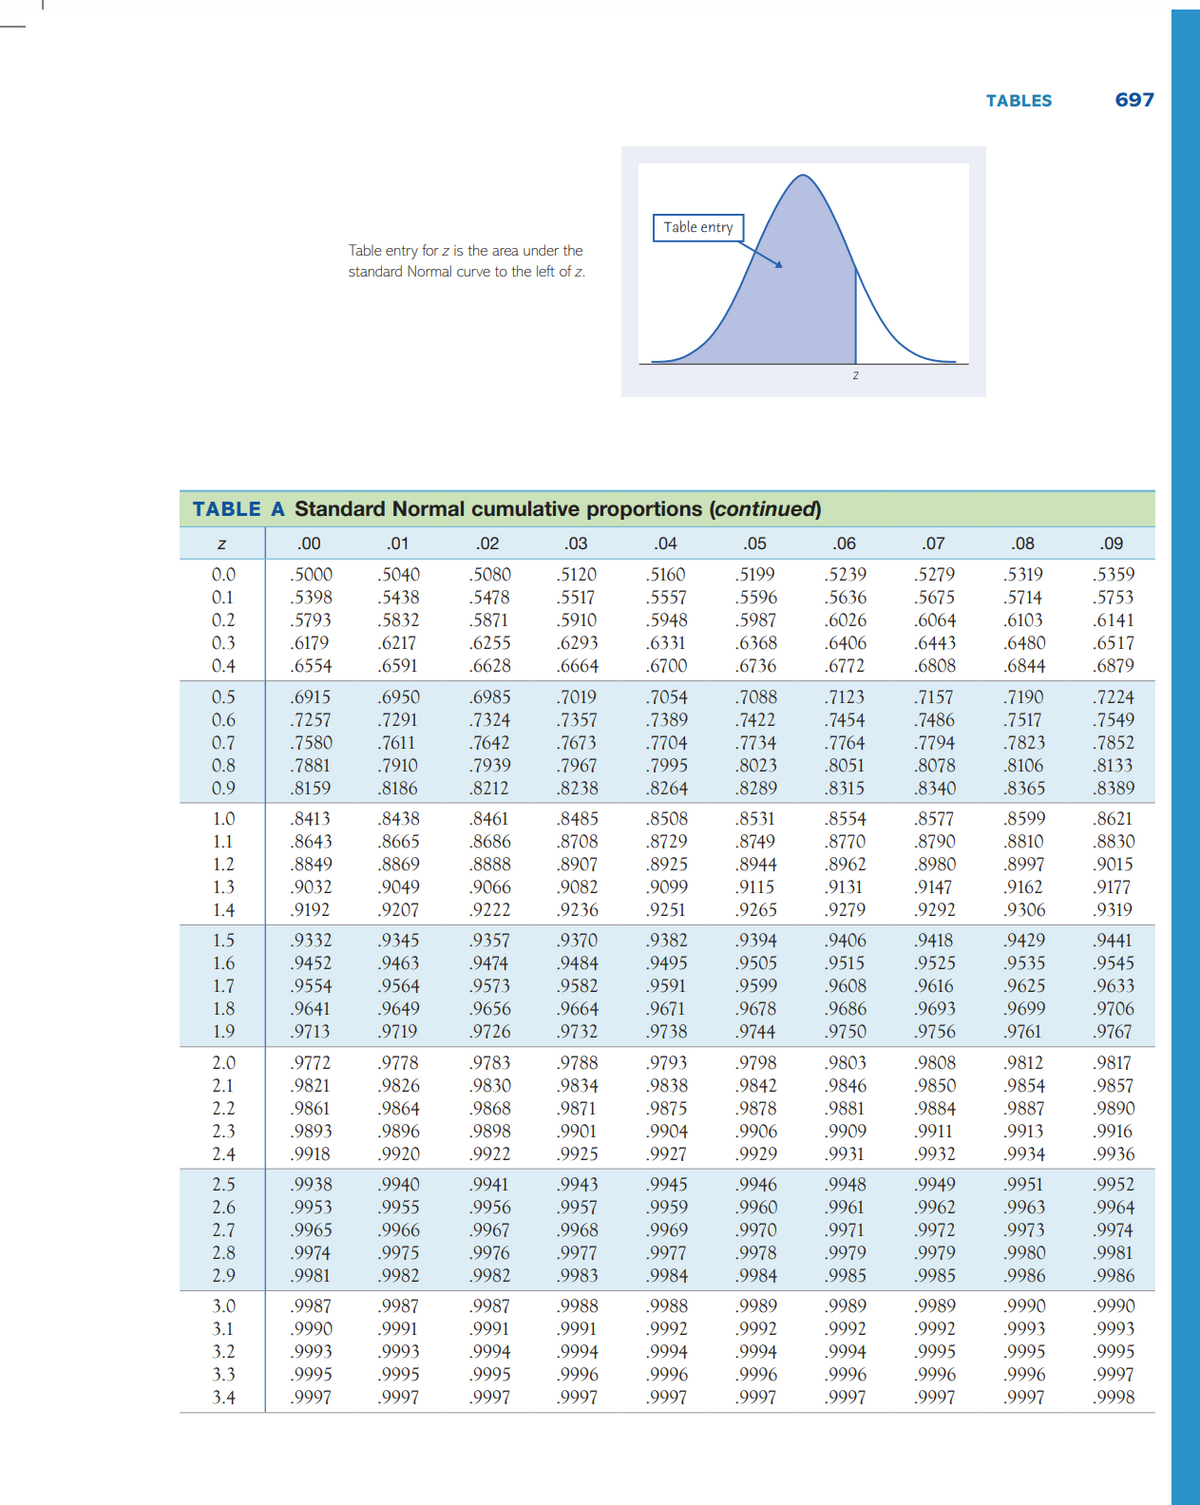
A new version of the Medical College Admissions Test (MCAT) was introduced in spring 2015 and is intended to shift the focus from what applicants know to how well they can use what they know. One result of the change is that the scale on which the exam is graded was modified, with the total score of the four sections on the test ranging from 472 to 528. In spring 2015, the mean score was 500.0 with a standard deviation of 10.6. (a) Assuming that the MCAT scores are normally distributed, use Table A to find the median and the first and third quartiles of the MCAT scores. Find the median of the MCAT scores. (Enter your answer rounded to a whole number.) median= Find the first quartile of the MCAT scores. (Enter your answer rounded to three decimal places.) Q1= Find the third quartile of the MCAT scores. (Enter your answer rounded to three decimal places.) Q3= Find the interquartile range of the MCAT scores. (Enter your answer rounded to three decimal places.) IQR= (b) Which interval contains the central 80%80% of the MCAT scores? Select the answer choice that approximates this interval. A) 491.096 to 508.904 B) 472 to 528 C) 480 to 520 D) 486.432 to 513.568


Inverse Normal Distribution
The method used for finding the corresponding z-critical value in a normal distribution using the known probability is said to be an inverse normal distribution. The inverse normal distribution is a continuous probability distribution with a family of two parameters.
Mean, Median, Mode
It is a descriptive summary of a data set. It can be defined by using some of the measures. The central tendencies do not provide information regarding individual data from the dataset. However, they give a summary of the data set. The central tendency or measure of central tendency is a central or typical value for a probability distribution.
Z-Scores
A z-score is a unit of measurement used in statistics to describe the position of a raw score in terms of its distance from the mean, measured with reference to standard deviation from the mean. Z-scores are useful in statistics because they allow comparison between two scores that belong to different normal distributions.
A new version of the Medical College Admissions Test (MCAT) was introduced in spring 2015 and is intended to shift the focus from what applicants know to how well they can use what they know. One result of the change is that the scale on which the exam is graded was modified, with the total score of the four sections on the test ranging from 472 to 528. In spring 2015, the mean score was 500.0 with a standard deviation of 10.6.
Quartiles: The observations Q1, Q2, And Q3 which divide the total number of observations into 4 equal parts are called Quartiles
Given,
Population mean =
Population standard deviation = = 10.6

Trending now
This is a popular solution!

Step by step
Solved in 3 steps


