A news article that you read stated that 50% of voters prefer the Democratic candidate. You think that the actual percent is smaller. 87 of the 208 voters that you surveyed said that they prefer the Democratic candidate. What can be concluded at the 0.05 level of significance? For this study, we should use Select an answer z-test for a population proportion t-test for a population mean Correct The null and alternative hypotheses would be: Ho: ? p μ Correct Select an answer = > < ≠ Correct Correct(please enter a decimal) H1: ? p μ Correct Select an answer ≠ = < > Correct Correct(Please enter a decimal) The test statistic ? t z Correct = (please show your answer to 3 decimal places.) The p-value =
A news article that you read stated that 50% of voters prefer the Democratic candidate. You think that the actual percent is smaller. 87 of the 208 voters that you surveyed said that they prefer the Democratic candidate. What can be concluded at the 0.05 level of significance? For this study, we should use Select an answer z-test for a population proportion t-test for a population mean Correct The null and alternative hypotheses would be: Ho: ? p μ Correct Select an answer = > < ≠ Correct Correct(please enter a decimal) H1: ? p μ Correct Select an answer ≠ = < > Correct Correct(Please enter a decimal) The test statistic ? t z Correct = (please show your answer to 3 decimal places.) The p-value =

MATLAB: An Introduction with Applications
6th Edition
ISBN:9781119256830
Author:Amos Gilat
Publisher:Amos Gilat
Chapter1: Starting With Matlab
Section: Chapter Questions
Problem 1P

Related questions

Topic Video
Question
A news article that you read stated that 50% of voters prefer the Democratic candidate. You think that the actual percent is smaller. 87 of the 208 voters that you surveyed said that they prefer the Democratic candidate. What can be concluded at the 0.05 level of significance?
- For this study, we should use Select an answer z-test for a population proportion t-test for a population mean Correct
- The null and alternative hypotheses would be:
Ho: ? p μ Correct Select an answer = > < ≠ Correct Correct(please enter a decimal)
H1: ? p μ Correct Select an answer ≠ = < > Correct Correct(Please enter a decimal)
- The test statistic ? t z Correct = (please show your answer to 3 decimal places.)
- The p-value =
Expert Solution
Step 1
From the provided information,
Population proportion (p) = 0.50
Sample size (n) = 208
Out of which 87 voters said that they prefer Democratic candidate that is x = 87
Sample proportion (p̂) = x/n = 87/208 = 0.4183
Level of significance (α) = 0.05
Step 2
1)
For this study, we should use z-test for a population proportion.
2)
The hypotheses can be constructed as:
H0: p = 0.50
H1: p < 0.50
The value of the test statistic can be obtained as:
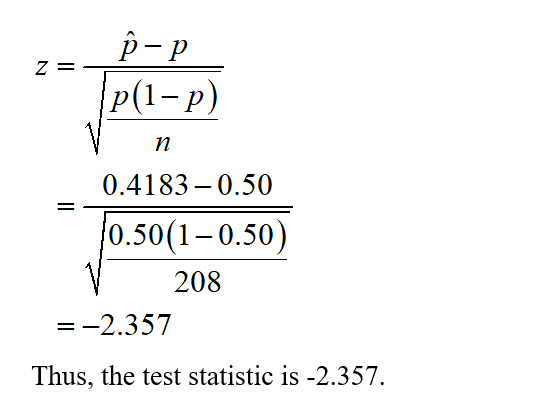

Step by step
Solved in 3 steps with 1 images

Knowledge Booster


Learn more about
Need a deep-dive on the concept behind this application? Look no further. Learn more about this topic, statistics and related others by exploring similar questions and additional content below.Recommended textbooks for you
MATLAB: An Introduction with Applications
Statistics
ISBN:
9781119256830
Author:
Amos Gilat
Publisher:
John Wiley & Sons Inc

Probability and Statistics for Engineering and th…
Statistics
ISBN:
9781305251809
Author:
Jay L. Devore
Publisher:
Cengage Learning

Statistics for The Behavioral Sciences (MindTap C…
Statistics
ISBN:
9781305504912
Author:
Frederick J Gravetter, Larry B. Wallnau
Publisher:
Cengage Learning
MATLAB: An Introduction with Applications
Statistics
ISBN:
9781119256830
Author:
Amos Gilat
Publisher:
John Wiley & Sons Inc
Probability and Statistics for Engineering and th…
Statistics
ISBN:
9781305251809
Author:
Jay L. Devore
Publisher:
Cengage Learning
Statistics for The Behavioral Sciences (MindTap C…
Statistics
ISBN:
9781305504912
Author:
Frederick J Gravetter, Larry B. Wallnau
Publisher:
Cengage Learning

Elementary Statistics: Picturing the World (7th E…
Statistics
ISBN:
9780134683416
Author:
Ron Larson, Betsy Farber
Publisher:
PEARSON

The Basic Practice of Statistics
Statistics
ISBN:
9781319042578
Author:
David S. Moore, William I. Notz, Michael A. Fligner
Publisher:
W. H. Freeman

Introduction to the Practice of Statistics
Statistics
ISBN:
9781319013387
Author:
David S. Moore, George P. McCabe, Bruce A. Craig
Publisher:
W. H. Freeman