A news article that you read stated that 53% of voters prefer the Democratic candidate. You think that the actual percent is different. 143 of the 275 voters that you surveyed said that they prefer the Democratic candidate. What can be concluded at the 0.10 level of significance? a. For this study, we should use Select an answer b. The null and alternative hypotheses would be: Но: ? (please enter a decimal) Hị: ? v (Please enter a decimal) c. The test statistic ? v (please show your answer to 3 decimal places.) d. The p-value = (Please show your answer to 4 decimal places.) e. The p-value is ? v f. Based on this, we should Select an answer v the null hypothesis. g. Thus, the final conclusion is that ... The data suggest the population proportion is not significantly different 53% at a = 0.10, so there is not sufficient evidence to conclude that the proportion of voters who prefer the Democratic candidate is different 53%. The data suggest the populaton proportion is significantly different 53% at a = 0.10, so there is sufficient evidence to conclude that the proportion of voters who prefer the Democratic candidate is different 53% The data suggest the population proportion is not significantly different 53% at a = 0.10, so there is sufficient evidence to conclude that the proportion of voters who prefer the Democratic candidate is equal to 53%. h. Interpret the p-value in the context of the study. There is a 73.96% chance that the percent of all voters who prefer the Democratic candidate differs from 53%. There is a 73.96% chance of a Type I error. If the sample proportion of voters who prefer the Democratic candidate is 52% and if another 275 voters are surveyed then there would be a 73.96% chance that we would conclude either fewer than 53% of all voters prefer the Democratic candidate or more than 53% of all voters prefer the Democratic candidate. If the population proportion of voters who prefer the Democratic candidate is 53% and if another 275 voters are surveyed then there would be a 73.96% chance that either fewer than 52% of the 275 voters surveyed prefer the Democratic candidate or more than 54% of the 275 voters surveyed prefer the Democratic candidate. i. Interpret the level of significance in the context of the study. There is a 10% chance that the earth is flat and we never actually sent a man to the moon.
A news article that you read stated that 53% of voters prefer the Democratic candidate. You think that the actual percent is different. 143 of the 275 voters that you surveyed said that they prefer the Democratic candidate. What can be concluded at the 0.10 level of significance? a. For this study, we should use Select an answer b. The null and alternative hypotheses would be: Но: ? (please enter a decimal) Hị: ? v (Please enter a decimal) c. The test statistic ? v (please show your answer to 3 decimal places.) d. The p-value = (Please show your answer to 4 decimal places.) e. The p-value is ? v f. Based on this, we should Select an answer v the null hypothesis. g. Thus, the final conclusion is that ... The data suggest the population proportion is not significantly different 53% at a = 0.10, so there is not sufficient evidence to conclude that the proportion of voters who prefer the Democratic candidate is different 53%. The data suggest the populaton proportion is significantly different 53% at a = 0.10, so there is sufficient evidence to conclude that the proportion of voters who prefer the Democratic candidate is different 53% The data suggest the population proportion is not significantly different 53% at a = 0.10, so there is sufficient evidence to conclude that the proportion of voters who prefer the Democratic candidate is equal to 53%. h. Interpret the p-value in the context of the study. There is a 73.96% chance that the percent of all voters who prefer the Democratic candidate differs from 53%. There is a 73.96% chance of a Type I error. If the sample proportion of voters who prefer the Democratic candidate is 52% and if another 275 voters are surveyed then there would be a 73.96% chance that we would conclude either fewer than 53% of all voters prefer the Democratic candidate or more than 53% of all voters prefer the Democratic candidate. If the population proportion of voters who prefer the Democratic candidate is 53% and if another 275 voters are surveyed then there would be a 73.96% chance that either fewer than 52% of the 275 voters surveyed prefer the Democratic candidate or more than 54% of the 275 voters surveyed prefer the Democratic candidate. i. Interpret the level of significance in the context of the study. There is a 10% chance that the earth is flat and we never actually sent a man to the moon.

College Algebra (MindTap Course List)
12th Edition
ISBN:9781305652231
Author:R. David Gustafson, Jeff Hughes
Publisher:R. David Gustafson, Jeff Hughes
Chapter8: Sequences, Series, And Probability
Section8.7: Probability
Problem 58E: What is meant by the sample space of an experiment?

Related questions
Question
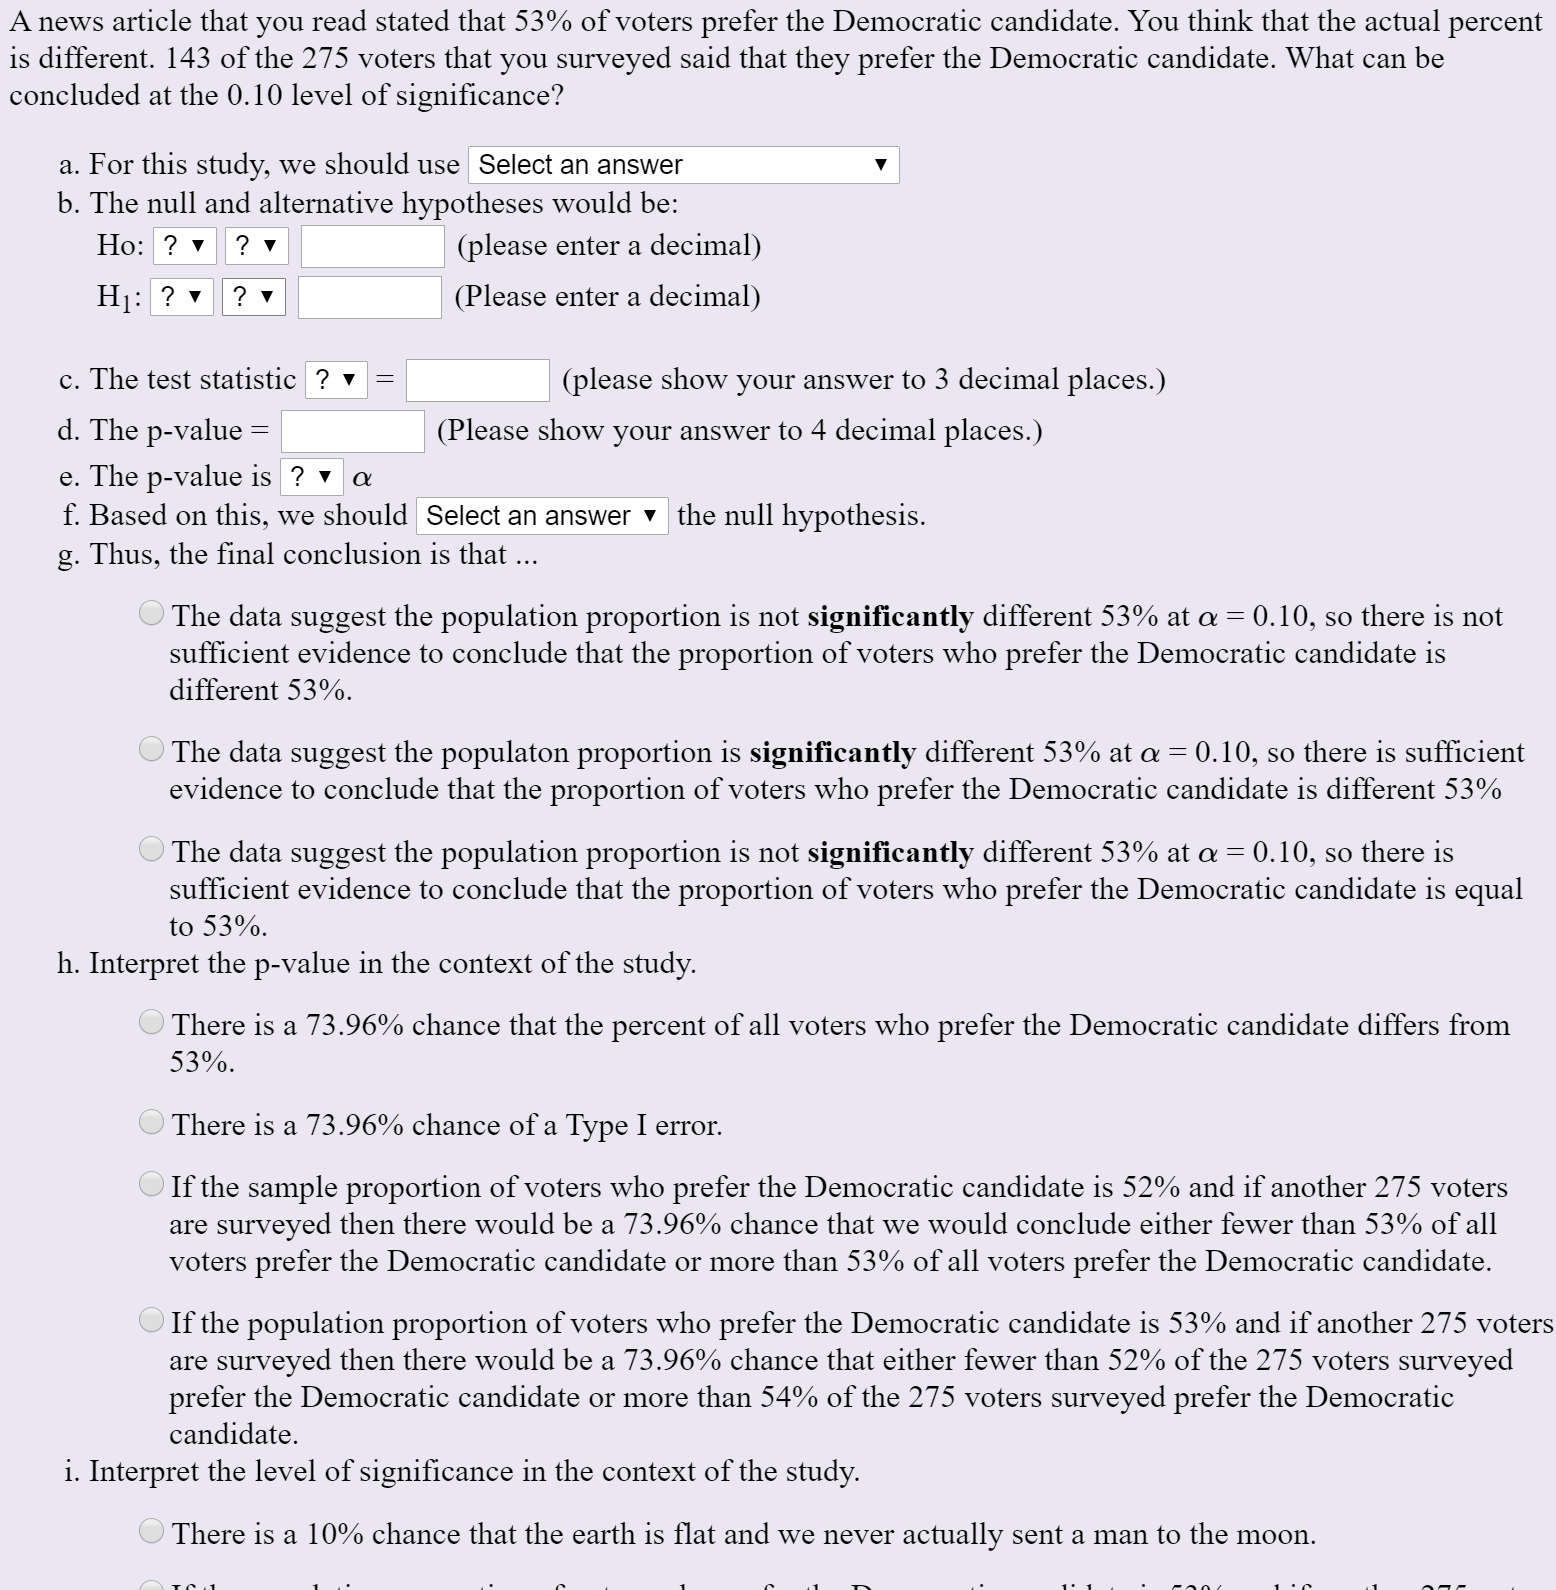
Transcribed Image Text:A news article that you read stated that 53% of voters prefer the Democratic candidate. You think that the actual percent
is different. 143 of the 275 voters that you surveyed said that they prefer the Democratic candidate. What can be
concluded at the 0.10 level of significance?
a. For this study, we should use Select an answer
b. The null and alternative hypotheses would be:
Но: ?
(please enter a decimal)
Hị:
? v
(Please enter a decimal)
c. The test statistic ? v
(please show your answer to 3 decimal places.)
d. The p-value =
(Please show your answer to 4 decimal places.)
e. The p-value is ? v
f. Based on this, we should Select an answer v the null hypothesis.
g. Thus, the final conclusion is that ...
The data suggest the population proportion is not significantly different 53% at a = 0.10, so there is not
sufficient evidence to conclude that the proportion of voters who prefer the Democratic candidate is
different 53%.
The data suggest the populaton proportion is significantly different 53% at a = 0.10, so there is sufficient
evidence to conclude that the proportion of voters who prefer the Democratic candidate is different 53%
The data suggest the population proportion is not significantly different 53% at a = 0.10, so there is
sufficient evidence to conclude that the proportion of voters who prefer the Democratic candidate is equal
to 53%.
h. Interpret the p-value in the context of the study.
There is a 73.96% chance that the percent of all voters who prefer the Democratic candidate differs from
53%.
There is a 73.96% chance of a Type I error.
If the sample proportion of voters who prefer the Democratic candidate is 52% and if another 275 voters
are surveyed then there would be a 73.96% chance that we would conclude either fewer than 53% of all
voters prefer the Democratic candidate or more than 53% of all voters prefer the Democratic candidate.
If the population proportion of voters who prefer the Democratic candidate is 53% and if another 275 voters
are surveyed then there would be a 73.96% chance that either fewer than 52% of the 275 voters surveyed
prefer the Democratic candidate or more than 54% of the 275 voters surveyed prefer the Democratic
candidate.
i. Interpret the level of significance in the context of the study.
There is a 10% chance that the earth is flat and we never actually sent a man to the moon.
Expert Solution
This question has been solved!
Explore an expertly crafted, step-by-step solution for a thorough understanding of key concepts.

This is a popular solution!

Trending now
This is a popular solution!

Step by step
Solved in 3 steps with 2 images

Recommended textbooks for you
College Algebra (MindTap Course List)
Algebra
ISBN:
9781305652231
Author:
R. David Gustafson, Jeff Hughes
Publisher:
Cengage Learning
College Algebra (MindTap Course List)
Algebra
ISBN:
9781305652231
Author:
R. David Gustafson, Jeff Hughes
Publisher:
Cengage Learning